Spotter Tools Pro
Severe weather, in your pocket and on your desktop. Storms in 3D, GPU radar, a deep radar archive, live wind flow, smart push alerts, and the full NWS / SPC suite, built for chasers and spotters.



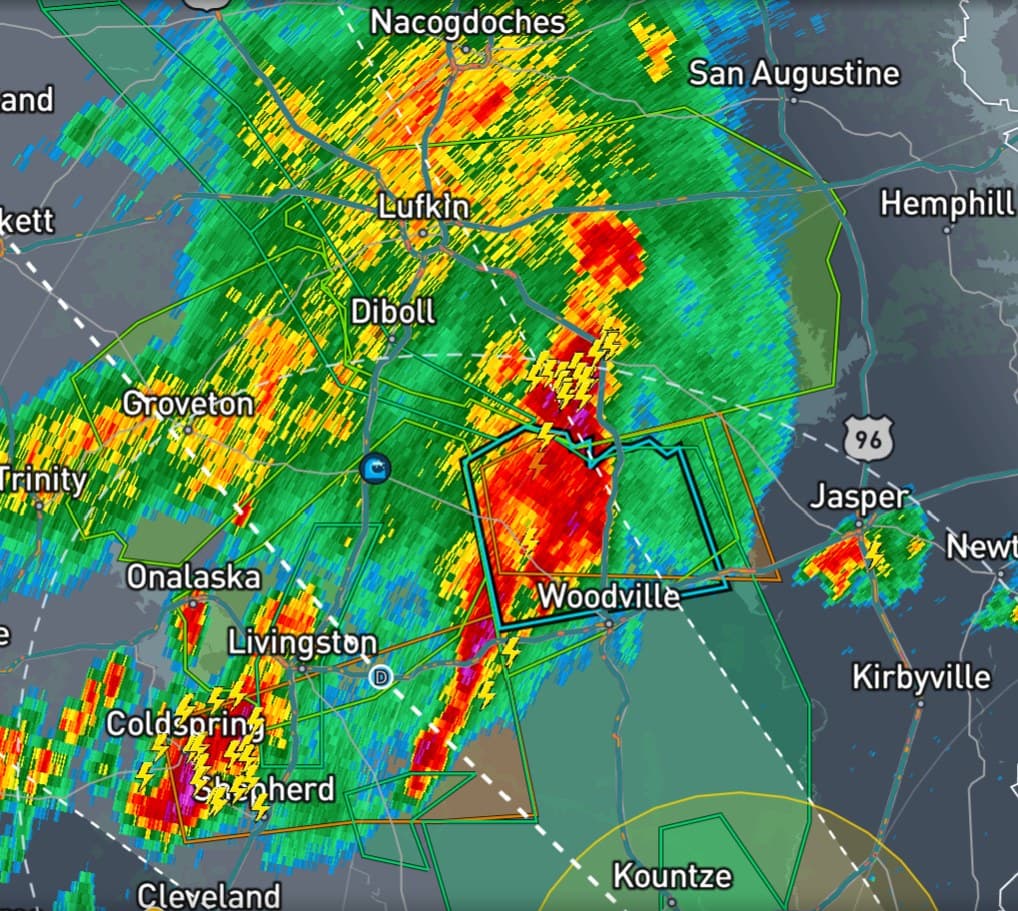
See it move
See It in the App
Every one of these was recorded right in the app. Here's what the headline features actually look like in the field.
Storms in 3D
Fly Around the Whole Storm
Radar has always been a flat slice. Now the whole Level 2 scan stands up as a solid you can orbit, so you see how a storm is built instead of inferring it one tilt at a time. Debris and rotation are marked inside the storm rather than hidden in a couplet you have to go find. Opacity follows rain rate, so heavy cores stay solid while light rain goes sheer and you can see straight into it from any side. Height is yours to set, including true scale, and the volume runs with the loop.
Nationwide in 3D
The Whole Mosaic, Stood Up
The 3D volume is not tied to one radar's umbrella. Switch to the national mosaic and you get the same solid anywhere in the lower 48, refreshed at about a two minute cadence, so a line running three states over reads as a structure rather than a smear. Site 3D and national 3D each carry their own opacity, so you can leave the mosaic sheer for context and keep your own radar solid on top of it.
Instant Level 2
Tap a Site, Get the Real Scan
Level 2 used to mean waiting on a full scan download before anything appeared. Six products now paint in about a second: reflectivity, velocity, correlation coefficient, spectrum width, storm relative velocity and normalized rotation. The scan time and VCP are printed right there, so you always know how old what you are looking at really is, and if the fast lane is ever slow the app falls back to the full decode rather than leaving you waiting.
Hurricane Hunters
Fly the Mission With the Recon Crews
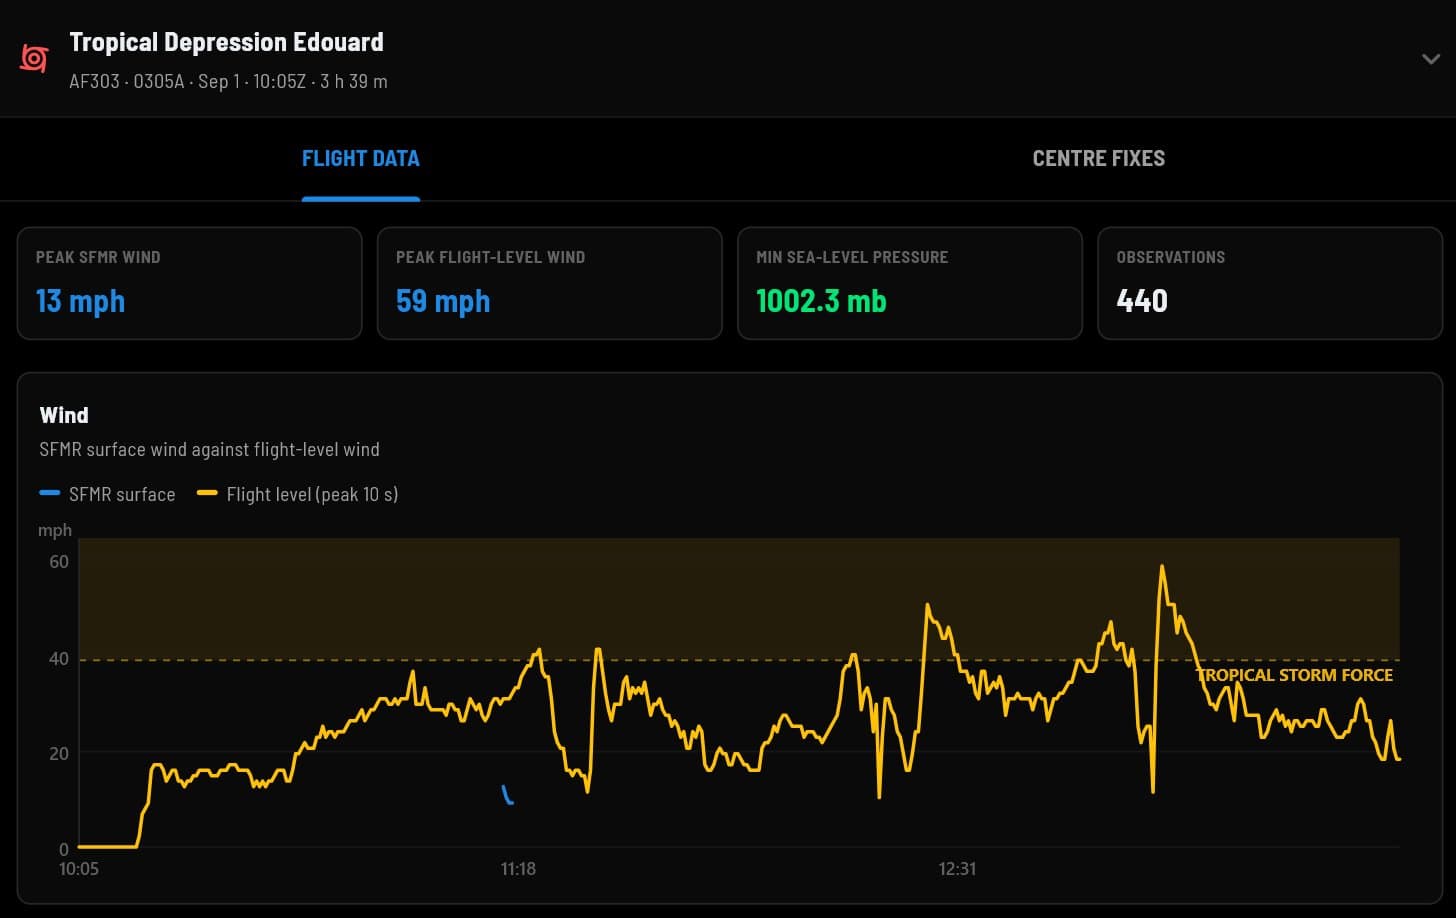
A new Aviation layer puts live NOAA and Air Force reconnaissance on the map: the flight track, flight-level observations, and the vortex centre fixes radioed back from the eye. Open Recon Graphs for the whole mission charted, surface wind against flight-level wind with the tropical-storm and hurricane-force bands marked, then pressure and the centre-fix history.
Local Storm Reports
Ground Truth, Minutes Old
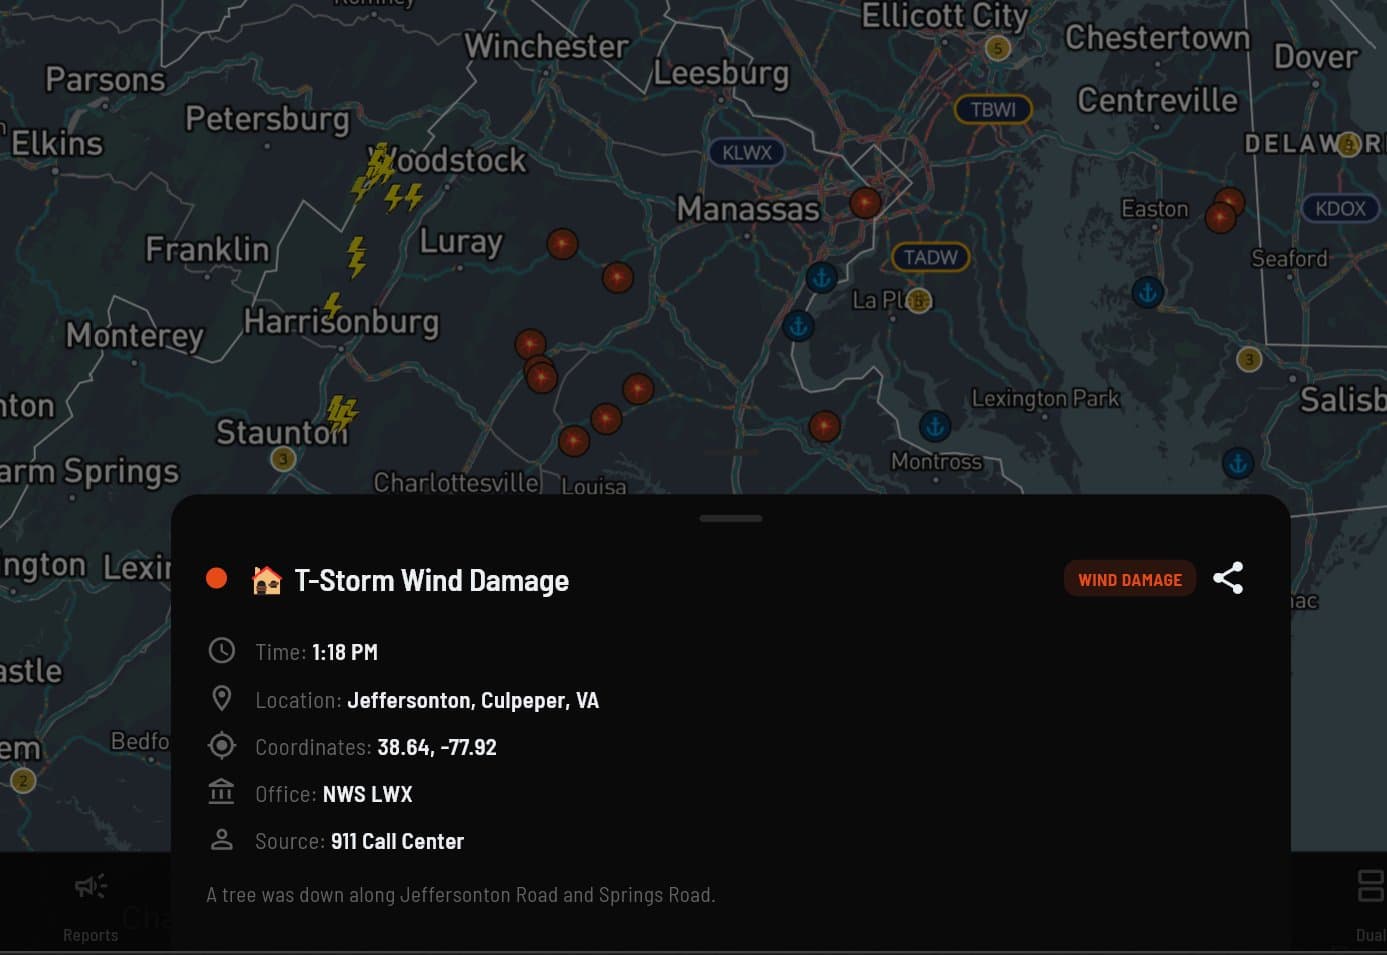
Storm reports now come straight from the NWS offices that publish them, minutes fresh, covering every report type from tornadoes and hail to downed trees and flooding. Tap any report for the full story, filter to what you care about, and get times in your own clock.
Point forecast
The Full NWS Forecast, Anywhere You Tap
Long-press the map, or search a city, for the complete National Weather Service forecast at that exact spot. Current conditions, the day and night periods in the forecaster's own words, a 48 hour trend chart, the Area Forecast Discussion, and every detail the local office publishes for that cell. It keeps the last forecast so you can still read it without signal.
Storm structure
Radar Cross Sections
Draw a line across a storm and get a vertical slice through it, so you can read the structure from the ground up instead of only the view from above. Full-volume decoding means every tilt of the scan is there.
Beam height
Tilt the Map, See the Beam Rise
Separate from the 3D volume, and useful for a different reason. Pitch the map and the radar beam climbs with distance, the way the real beam does, which makes overshoot obvious: at 100 miles out you are not looking at the storm's base, you are looking well up inside it.
Live wind
Watch the Wind Move
The live wind layer renders real surface wind as thousands of flowing, speed-colored particles, an at-a-glance read on outflow, convergence, and where it's really blowing.
Severe parameters
Mesoanalysis
SPC-style severe-weather parameters layered right under the radar: CAPE, shear, storm-relative helicity, and derived composites like Supercell and Significant Tornado, sampled anywhere with a bilinear crosshair readout.
Cell interrogation
Storm Cell Deep Dive
Tap a cell for an expanded readout: rainfall rate, peak reflectivity, storm-top height, footprint, mass and volume, an age tracker, and at-a-glance severe indices.
Storm tracking
Storm Tracks & Cell Characteristics
Level III storm tracks and cell attributes show where each cell is headed and how it's evolving, so you can size up the strongest storms at a glance.
Compare
Dual-View Radar
Split the screen to compare two radar views side by side (different products or two sites), each pane with its own independent controls.
On the ground
Live Traffic & Sky Cameras
Tens of thousands of cameras right on the map, with live video where the agency streams it, so you can see conditions on the ground in real time.
In the field
See It in Action
A few highlights from the app. Explore the deep-dive pages for the full tour.
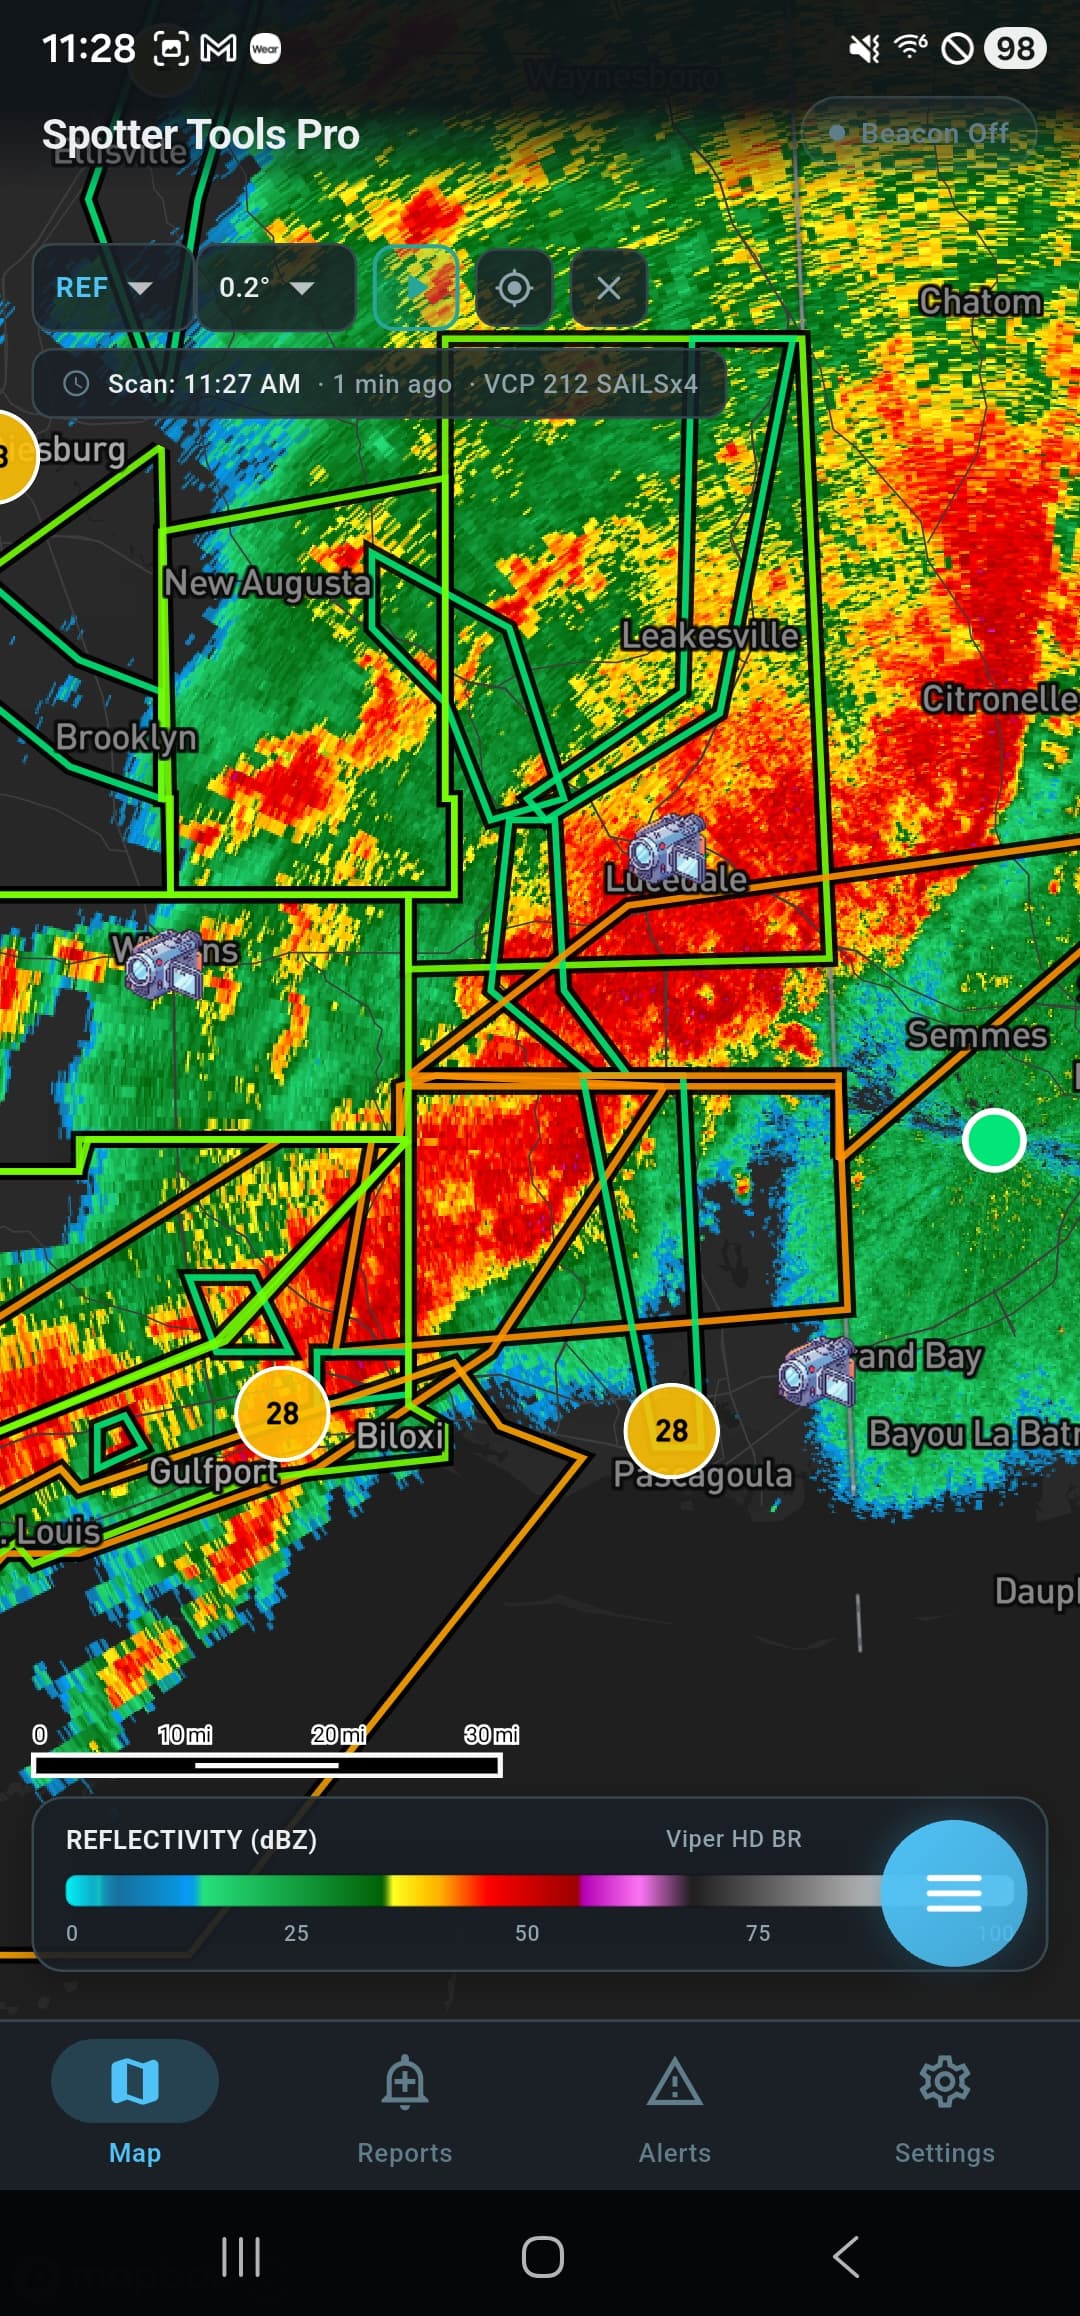
Single-site NEXRAD Level 2, decoded on-device, with warning polygons
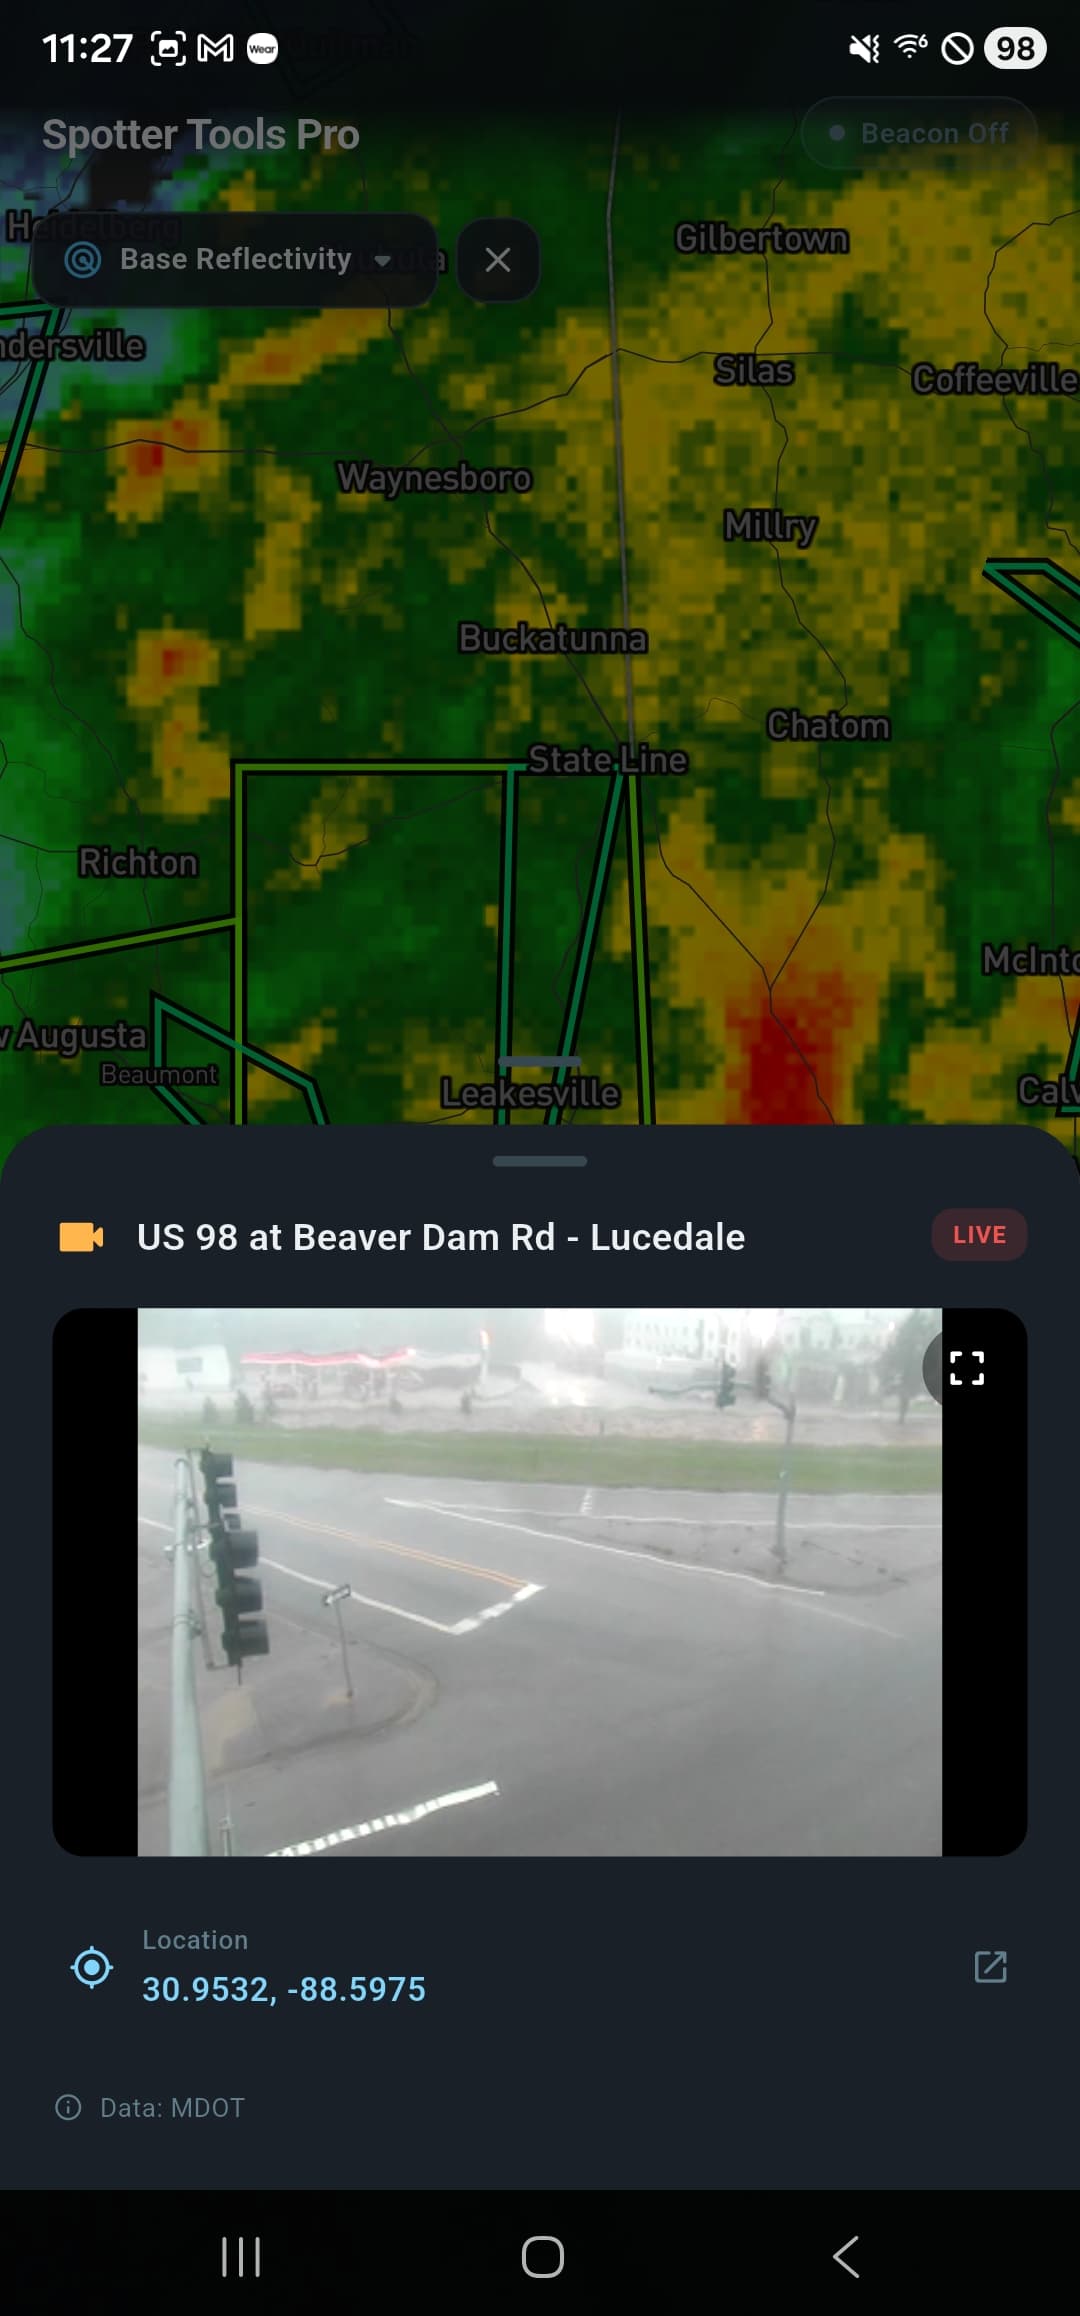
Tens of thousands of live traffic & sky cameras, right on the map
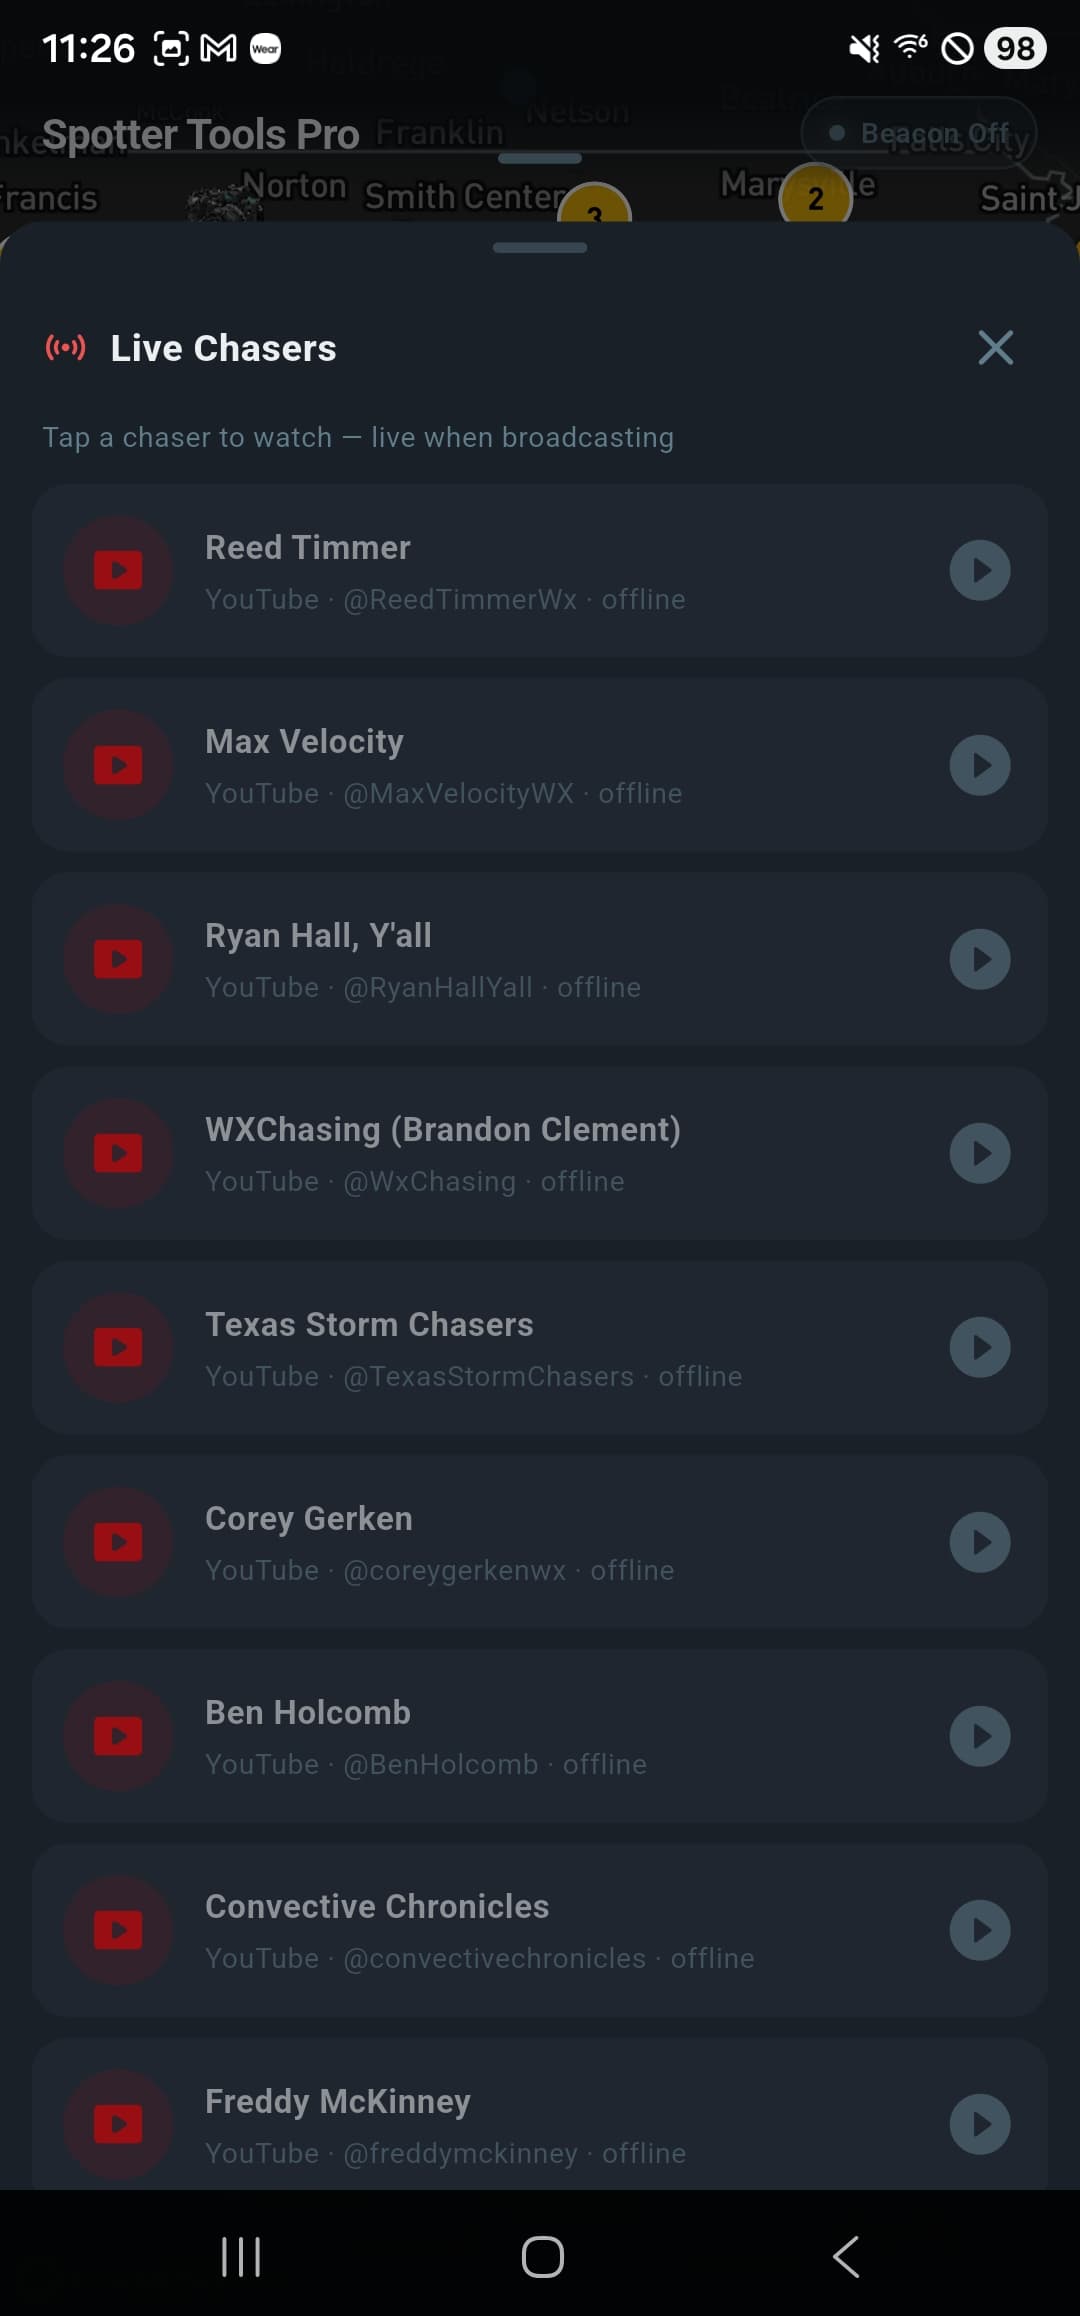
Live Storm Chasers: watch the field via YouTube & Facebook Live
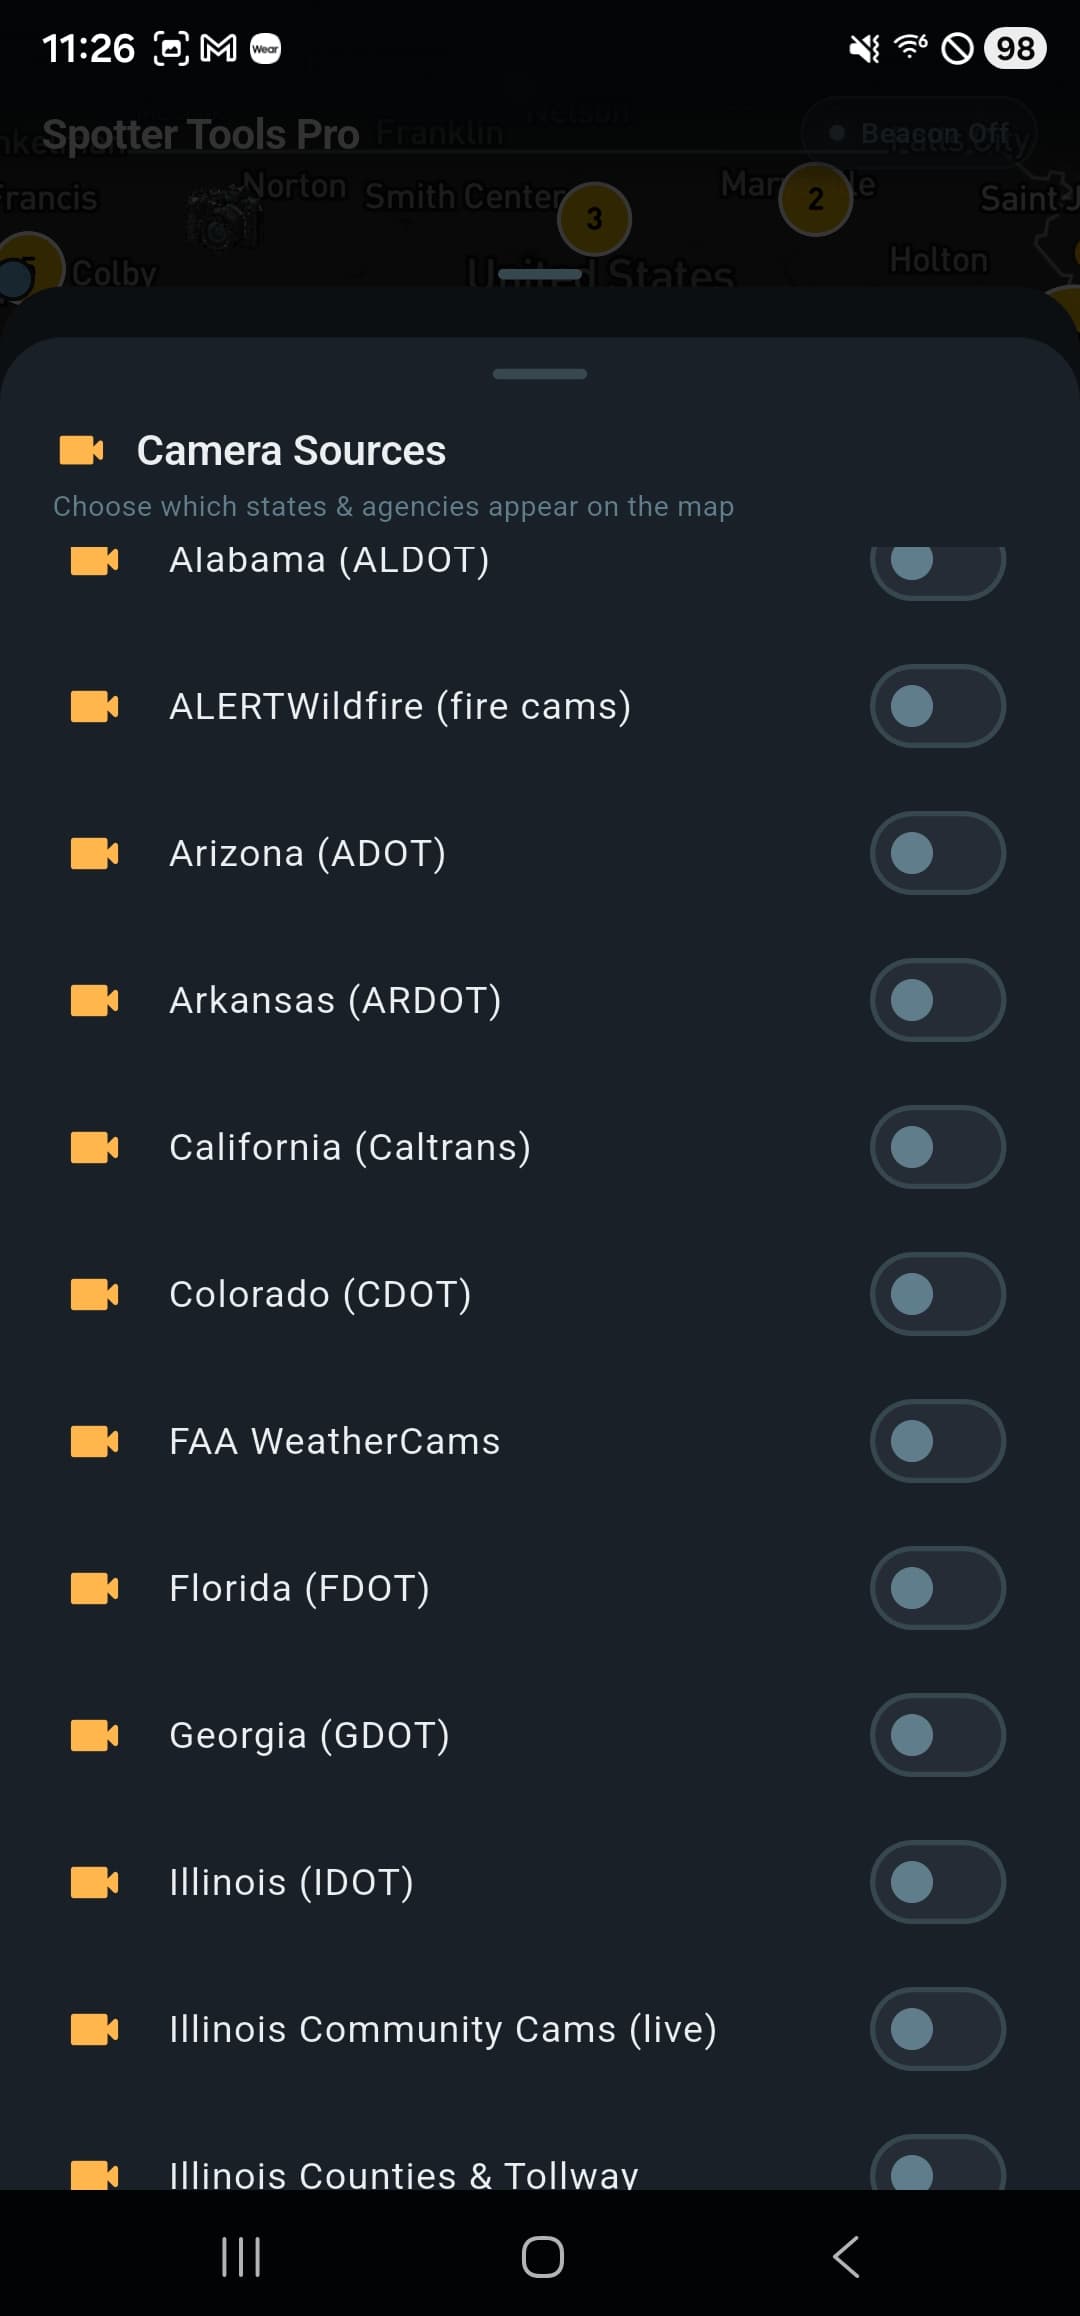
61 camera sources across 48 states, pick what you see
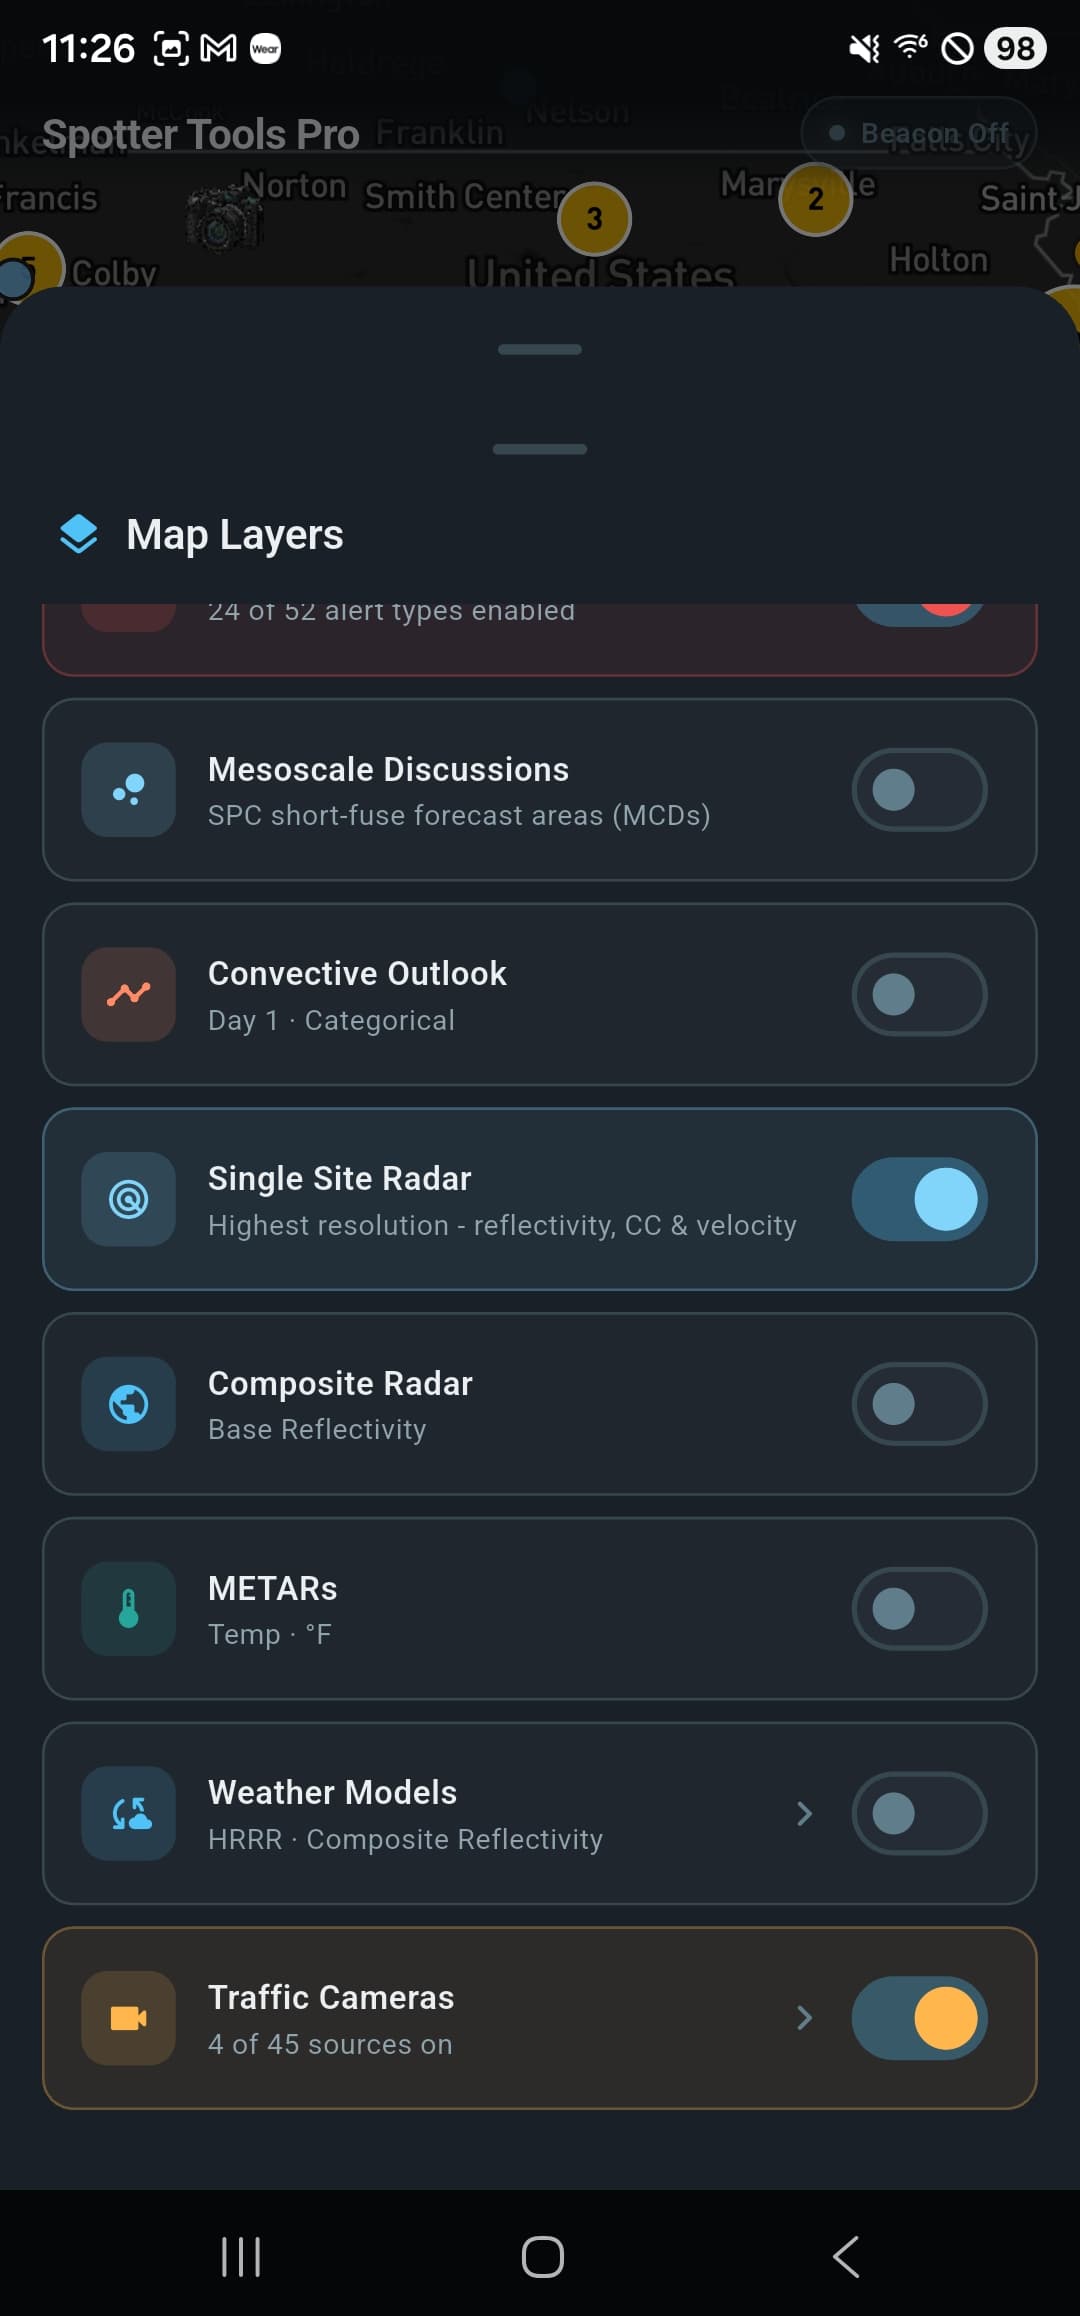
Granular layers: radar, weather models, cameras & more
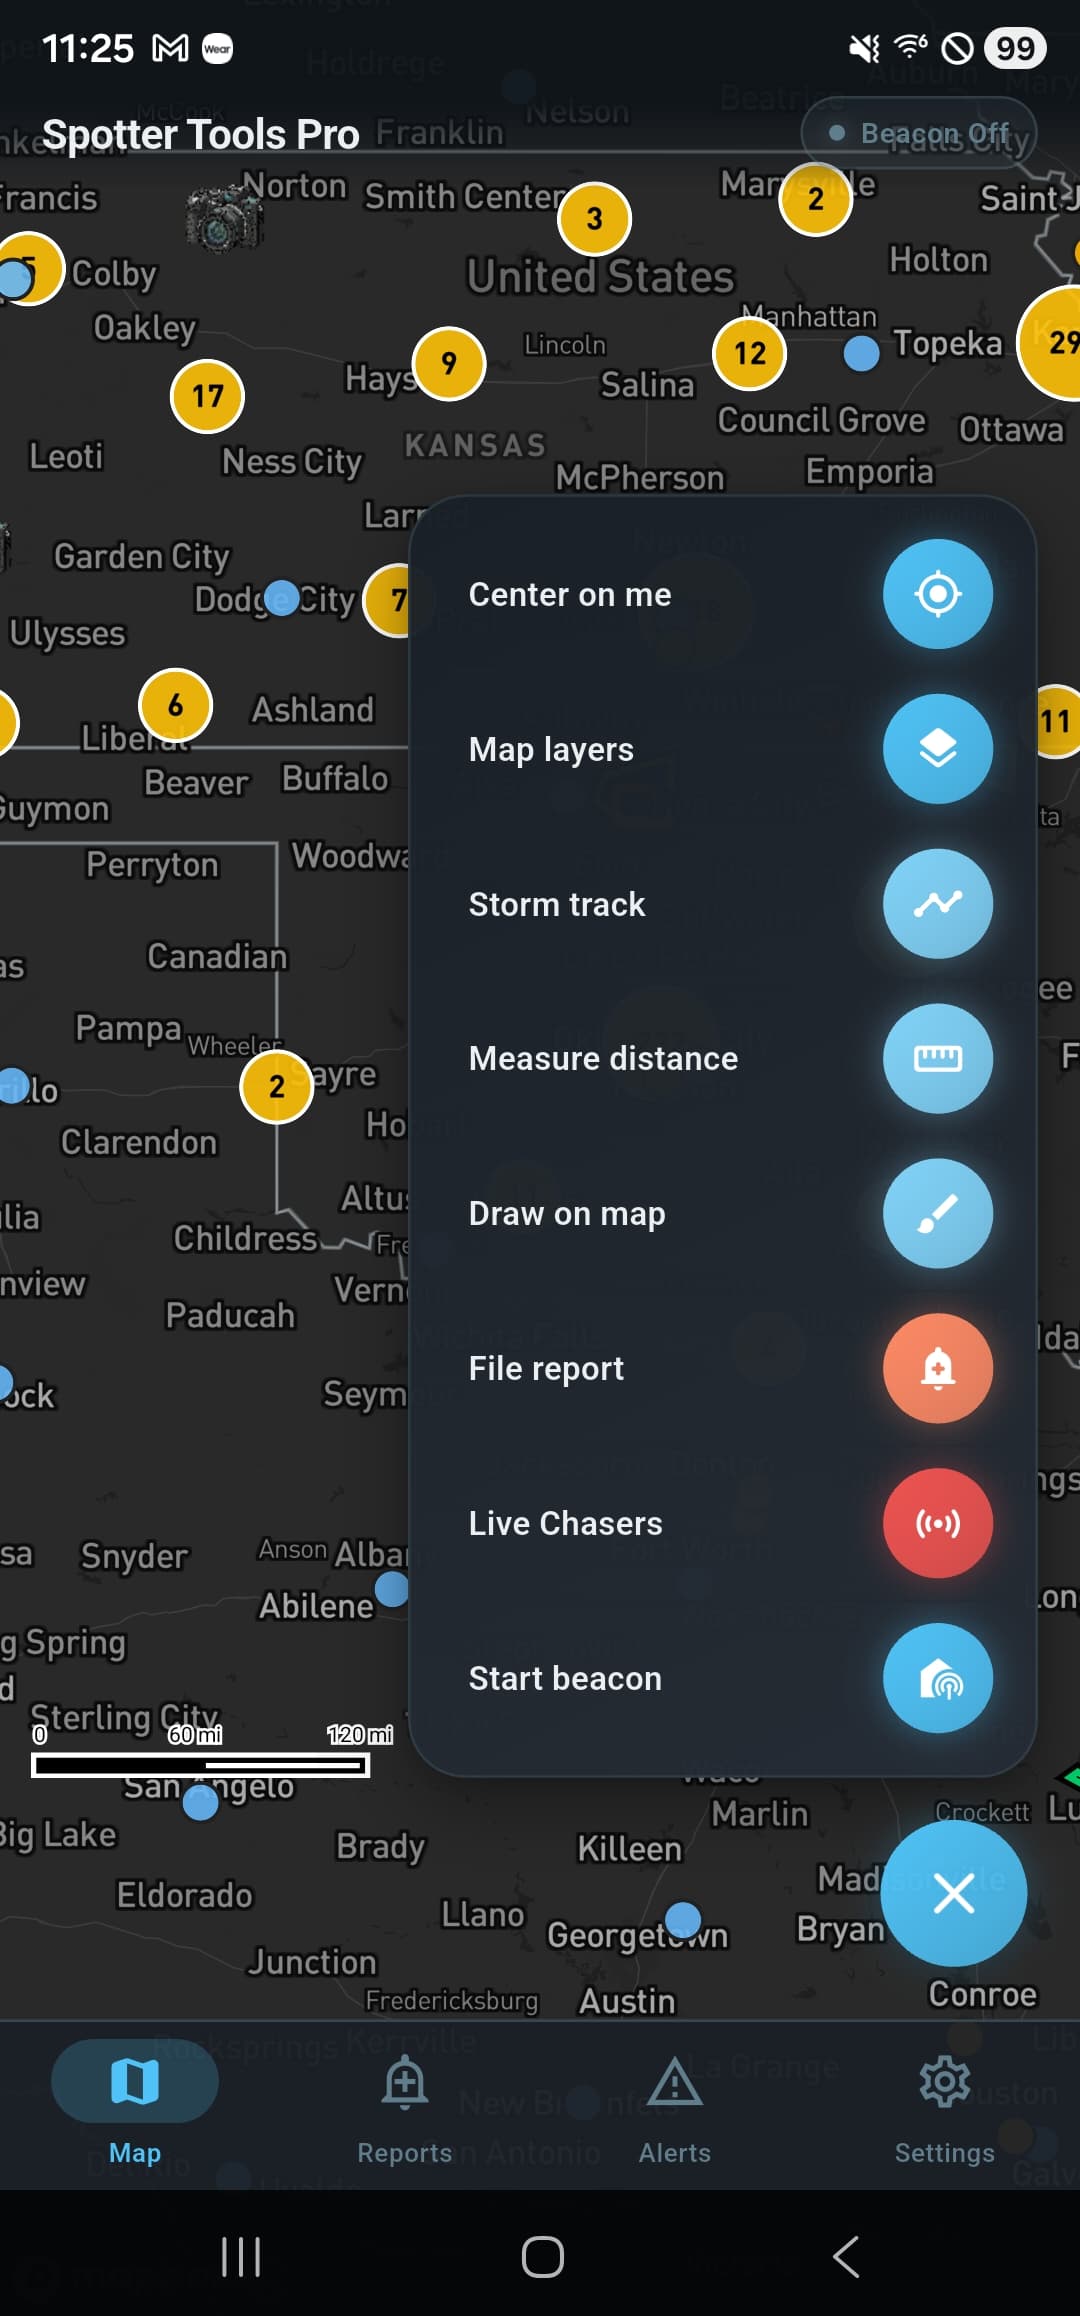
One-tap field tools: storm track, report, beacon, Live Chasers
Capabilities
Everything Severe Weather, in One App
The highlights. Pro-grade tools with no ads, no third-party trackers, and no required account.
Storms in 3D
Stand the whole scan up as a solid you can fly around. Your own site's Level 2 volume in full detail, or the nationwide mosaic anywhere in the lower 48. Debris and rotation are marked inside the storm, cores show through the envelope, and it plays with the loop. Our servers build the volume, so it appears almost immediately.
Learn moreGPU Radar: Level 2, III & TDWR
GPU-rendered and crisp at any zoom. NEXRAD Level 2 decoded on-device, WSR-88D Level III and dual-pol products, vertical cross sections, a VAD Wind Profile panel, storm tracks with mesocyclone and TVS markers, and the 45-site TDWR network. Six Level 2 products paint in about a second. Level III loops run about eight hours deep.
Learn moreRadar Archive to the 1990s
Pick a date and a time and the radar loads as it was at that instant, with storm tracks and mesocyclones along for the ride. Level 2 reaches back to 1991 and Level III to 1992, so Moore, El Reno and Bridge Creek all load. Enter the time in whichever zone you are thinking in and the app converts it.
Learn moreShare Any Loop as a GIF or MP4
Record what is on screen and hand it straight to the share sheet: single-site radar, the national composite, satellite, weather models or air quality. Every frame carries a stamp so the loop still says what it is once it leaves the app.
Learn moreStorm Track Projection
Draw the storm's leading edge and you are done. The motion comes off the radar automatically, and you get the swath, time marks across it, and every town in the path with its arrival time, down to villages of a few hundred people.
Learn moreDraw on the Map
Mark up the map and have it stay put through pan, zoom and tilt. Freehand, lines, arrows, boxes and circles, eleven forecaster presets including fronts with correct pips, per-shape measurements, a saved library and PNG export.
Learn moreLive Wind Flow
Real surface wind as thousands of flowing, speed-colored particles, drawn on top of every layer so it is never buried. Density, size, speed and opacity are all yours to tune.
Learn moreOn-Device Soundings
Skew-T and hodograph for any point, observed balloon data or forecast profiles, with a full parameter analysis and a plain-language read of what the environment supports.
Learn moreSmart Push Alerts
A background watch worker with custom zones, including your home, population inside the polygon, filter modes up to Outbreak, custom sounds with DND override, and a full-screen takeover for Tornado Emergencies. Earthquake, wildfire and air quality alerts too.
Learn moreGPS Beacon to Spotter Network
Foreground and background beacon transmission so the NWS and fellow spotters see exactly where you are. Auto-restarts on device boot.
Learn moreLive Traffic & Sky Cameras
Tens of thousands of cameras on the map with live video where the agency streams it, across 61 state DOT and specialty sources covering 48 states. See conditions on the ground before you commit to a route.
Learn moreTropical, and the Hurricane Hunters
Worldwide tropical cyclone tracking with forecast cones, wind fields, satellite and NHC products, on the same map as your radar. Plus a live Aviation layer carrying NOAA and Air Force reconnaissance: flight-level observations along the track, the vortex centre fixes the crews send back from the eye, and a Recon Graphs screen charting the whole mission.
Learn morePricing
Buy It Once. Keep It Forever.
Most weather apps in this class bill you every month or every year. Spotter Tools Pro is a one-time $19.99 purchase: no subscription, no ads, no required account.
| App | Pricing model | What you pay |
|---|---|---|
| Spotter Tools Pro | One-time purchase | $19.99 once, no subscription |
| RadarScope | Paid app + Pro subscription | $9.99 app + $9.99 to $99.99 / year |
| RadarOmega | Paid app + subscription | $8.99 app + $49 to $119 / year |
| WeatherWise | Free app + subscription | $69.99 to $159.99 / year |
| WeatherFront | Free app + subscription | $99.99 / year |
Every other option here bills you again next year. Spotter Tools Pro doesn't. Pay $19.99 once and every feature is yours.
Competitor pricing as of June 2026, taken from each app's App Store listing or official site; those prices are set by their makers and may change. Comparison reflects pricing model only.
Built by a Spotter, for Everyone Who Watches the Sky
Spotter Tools Pro started as a focused field tool for certified SKYWARN storm spotters and Spotter Network members, and it still is. But the same pro-grade radar, alerts, and live cameras now serve storm chasers and weather enthusiasts too. No bloated features, no ads, no data harvesting. Just the tools to keep you informed during severe weather.
Your position data goes directly to Spotter Network. Weather data comes directly from the NWS and Storm Prediction Center. No ad networks, no third-party trackers, and no middlemen in that path. We do collect anonymous usage statistics to see which features are worth building on, with no account or identity attached, and you can switch that off in Settings under Privacy. Nothing is ever sold.