Radar
Real radar, not a screenshot
NEXRAD Level 2 decoded directly on your phone, a 3D storm volume you can fly around, a CONUS composite for the big picture, a full animation transport, and color tables you can swap or import.
Single-Site Radar
NEXRAD Level 2, decoded on-device
Spotter Tools Pro decodes raw NEXRAD Level 2 archive files directly on your phone, no third-party tile server in between, and no degraded composite resolution.
Pick a WSR-88D site (or let the app choose the closest one) and view three products at full radial resolution.
- Reflectivity (BR), base reflectivity for precipitation intensity
- Velocity (BV), base velocity for rotation and outflow
- Correlation Coefficient (CC), debris signature and hydrometeor class
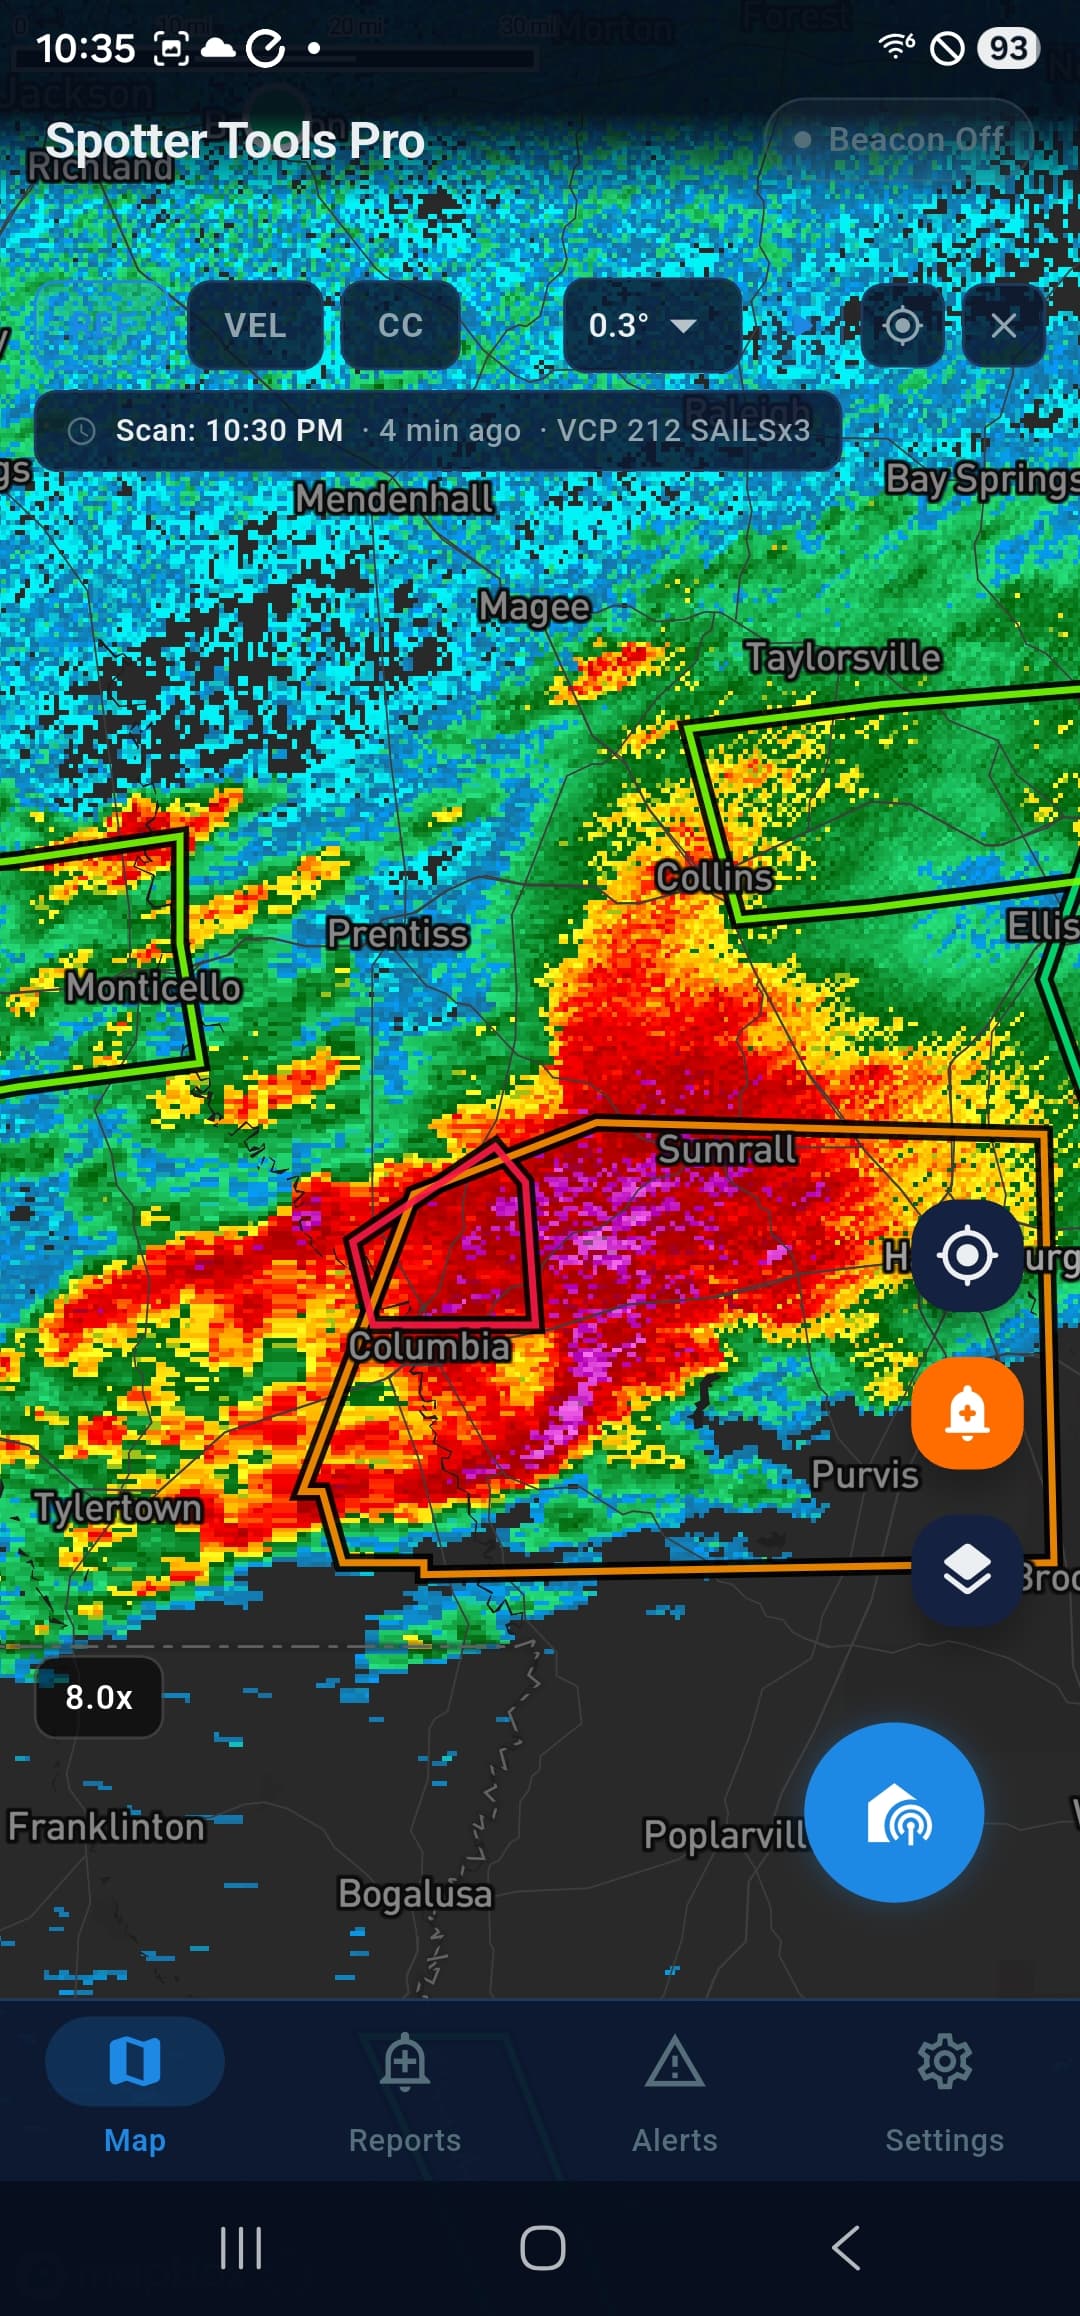
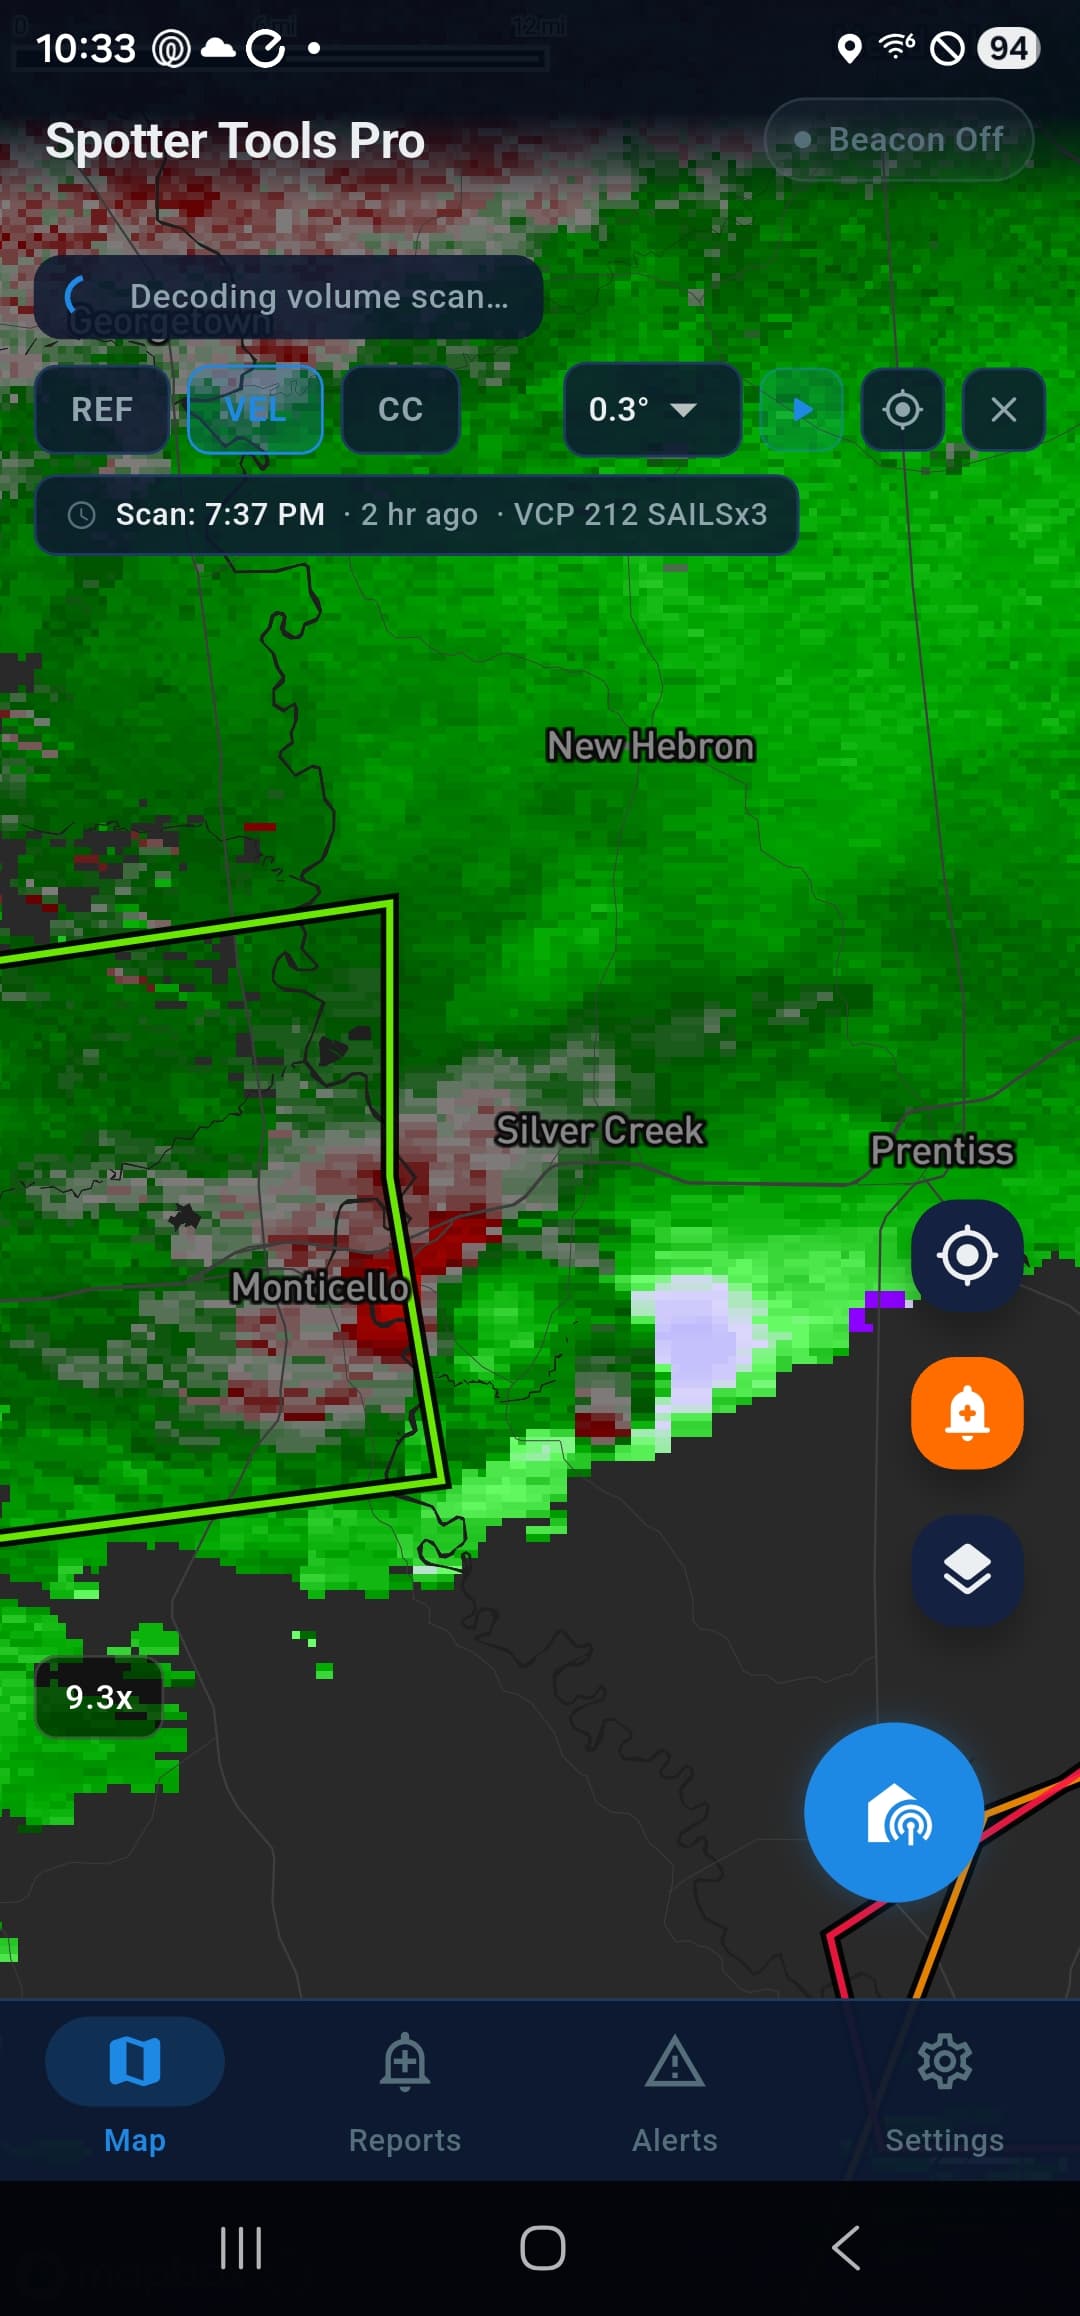
Velocity & CC
Rotation, outflow, and debris in one tap
Switch between BR, BV, and CC instantly to confirm rotation, mark outflow boundaries, and check for debris signatures during a tornado event, without leaving the map.
3D Storm Volume
The whole scan, standing up
Radar has always been a flat slice. Turn the volume on and every tilt of the Level 2 scan is resampled into a single solid you can fly around, so you read how a storm is built instead of inferring it one elevation at a time.
Two ways in, and it follows whichever layer you are on: your own site's volume for one storm in full detail, or the nationwide mosaic at about a two minute cadence so you are not tied to one radar's umbrella. Each carries its own opacity, so the mosaic can stay sheer for context while your site's radar stays solid on top.
Our servers build the volume and send it down ready to draw, so it appears almost immediately rather than after your phone has ground through a full scan. If no prepared volume exists for your site, the app quietly builds one locally as before.
- Debris and rotation marked inside the storm, not hidden in a couplet you have to find
- Opacity follows rain rate, so heavy cores stay solid and light rain goes sheer
- Height is yours to set, including true scale for real proportions
- It plays with the loop, so you watch a storm build and collapse in three dimensions
- Renders at whatever resolution keeps your device smooth, dropping detail before frames
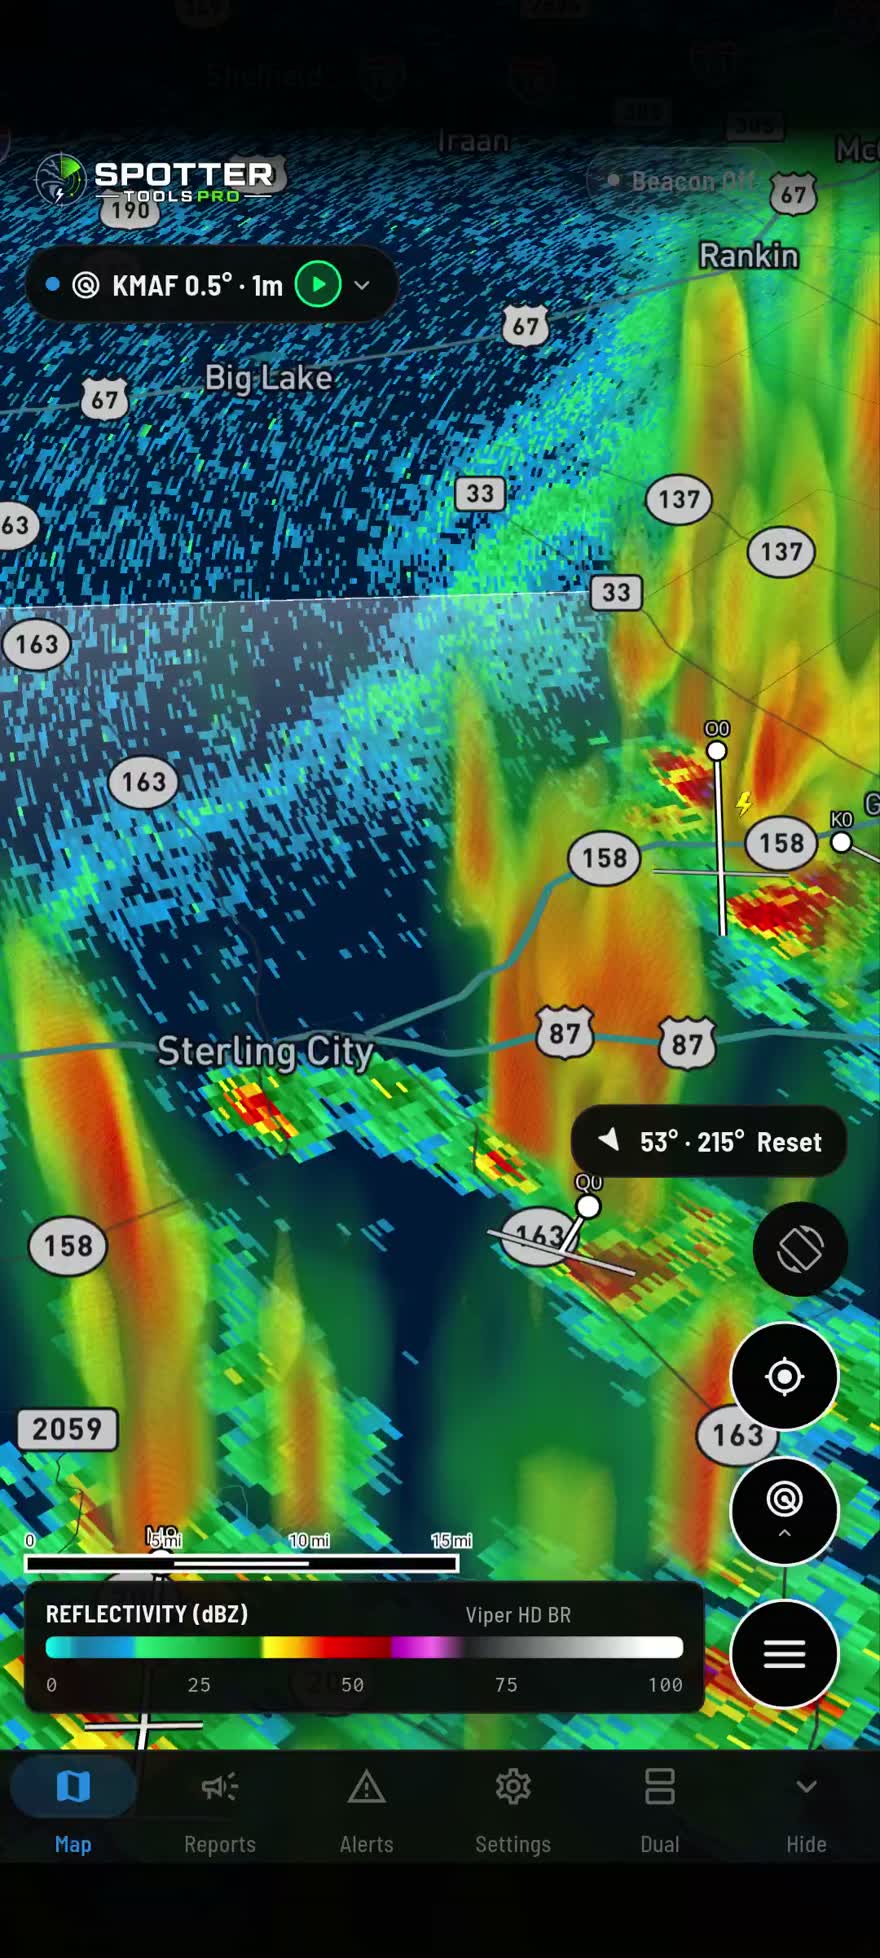
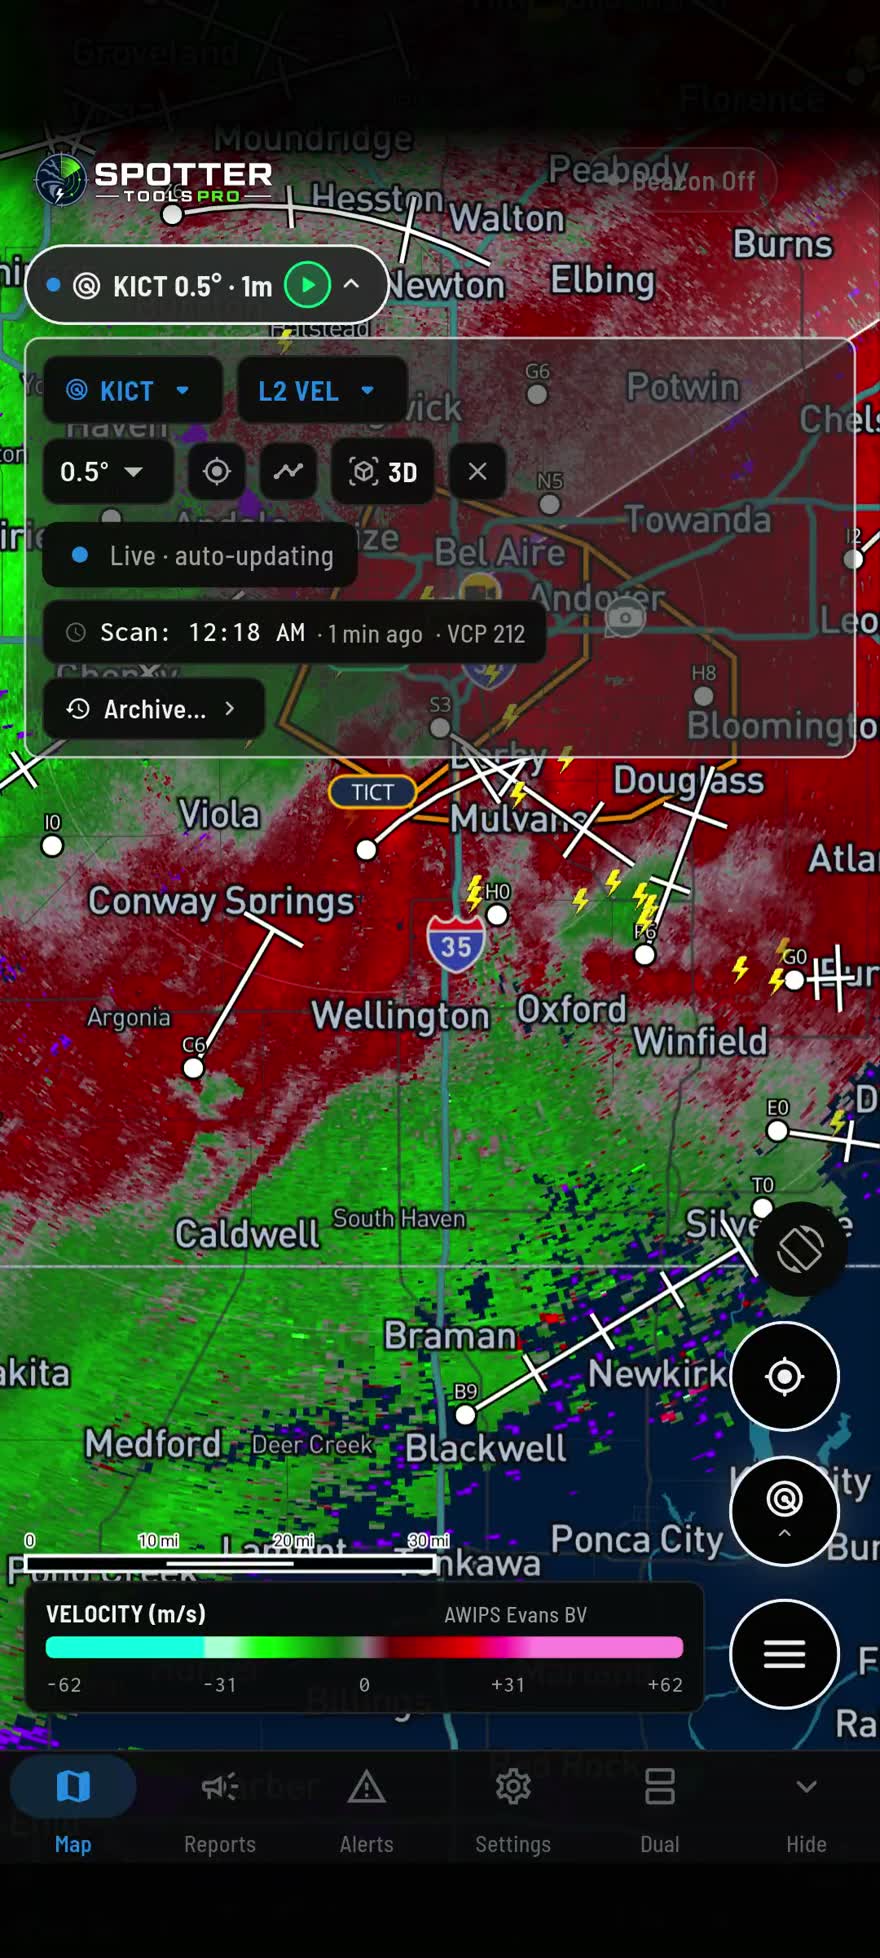
Instant Level 2
Tap a site, get the real scan
Level 2 used to mean waiting on a full scan download before anything appeared on screen. Six products now paint in about a second: reflectivity, velocity, correlation coefficient, spectrum width, storm relative velocity and normalized rotation.
The scan time and VCP are printed on the panel, so you always know how old what you are looking at really is. Opening a site paints the real Level 2 data rather than standing in a Level III picture that can be a minute older.
Nothing about it can leave you worse off. If the fast lane is slow or unavailable, the app falls back to the full on-device decode it always did.
Animation
Full radar transport bar
Loop the past several volume scans with the controls you'd expect from a desktop radar app, but built for one-thumb use in the truck.
Deep loops are held compactly and expanded only as each frame is shown, so a long loop fits in memory, loads faster and plays smoothly instead of being thinned down to a handful of frames.
- Play / pause and step forward / back frame by frame
- Drag the timeline scrubber to any frame in the loop
- Pick playback speed, slow walk-throughs or full-pace loops
- Pick frame count, up to about eight hours of Level III history
- Background frame loading with progress so you know when it's ready
- Optional FastScan sweep: a beam-reveal animation with range rings and live pipeline chips
Radar Archive
Scrub back to any date and time
The map has a second clock. Pick a date and a time and the radar loads as it was at that instant, so you can walk back through an event you missed or study one you did not.
Storm cell tracks and mesocyclone markers load at the same instant, and an amber banner with a Return to Live button rides the top of the map so you always know which clock you are on.
- Level III back to May 1992, keeping its full loop depth
- Level 2 back to June 1991, with the download size shown before you spend it
- Enter the time in Local, UTC, Eastern, Central, Mountain, Arizona, Pacific, Alaska or Hawaii, and it converts for you
- A same-moment line cross references UTC and your own zone, with the date, so a lookup that rolled past midnight is obvious
- Storm-relative velocity, the cross section and the wind profile all follow the archived clock rather than today's
- Layers with no history switch off rather than sitting on live data under a past-tense banner
- Loops build about a third faster than they used to and start playing sooner: a cold two hour Level 2 loop went from about two and a half minutes to about a minute and forty
- Each frame downloads only the part of the file it needs and unpacks only the tilt it paints, rather than the whole scan
- Phones with memory to spare keep more of the loop instead of thinning a two hour loop down to a handful of frames
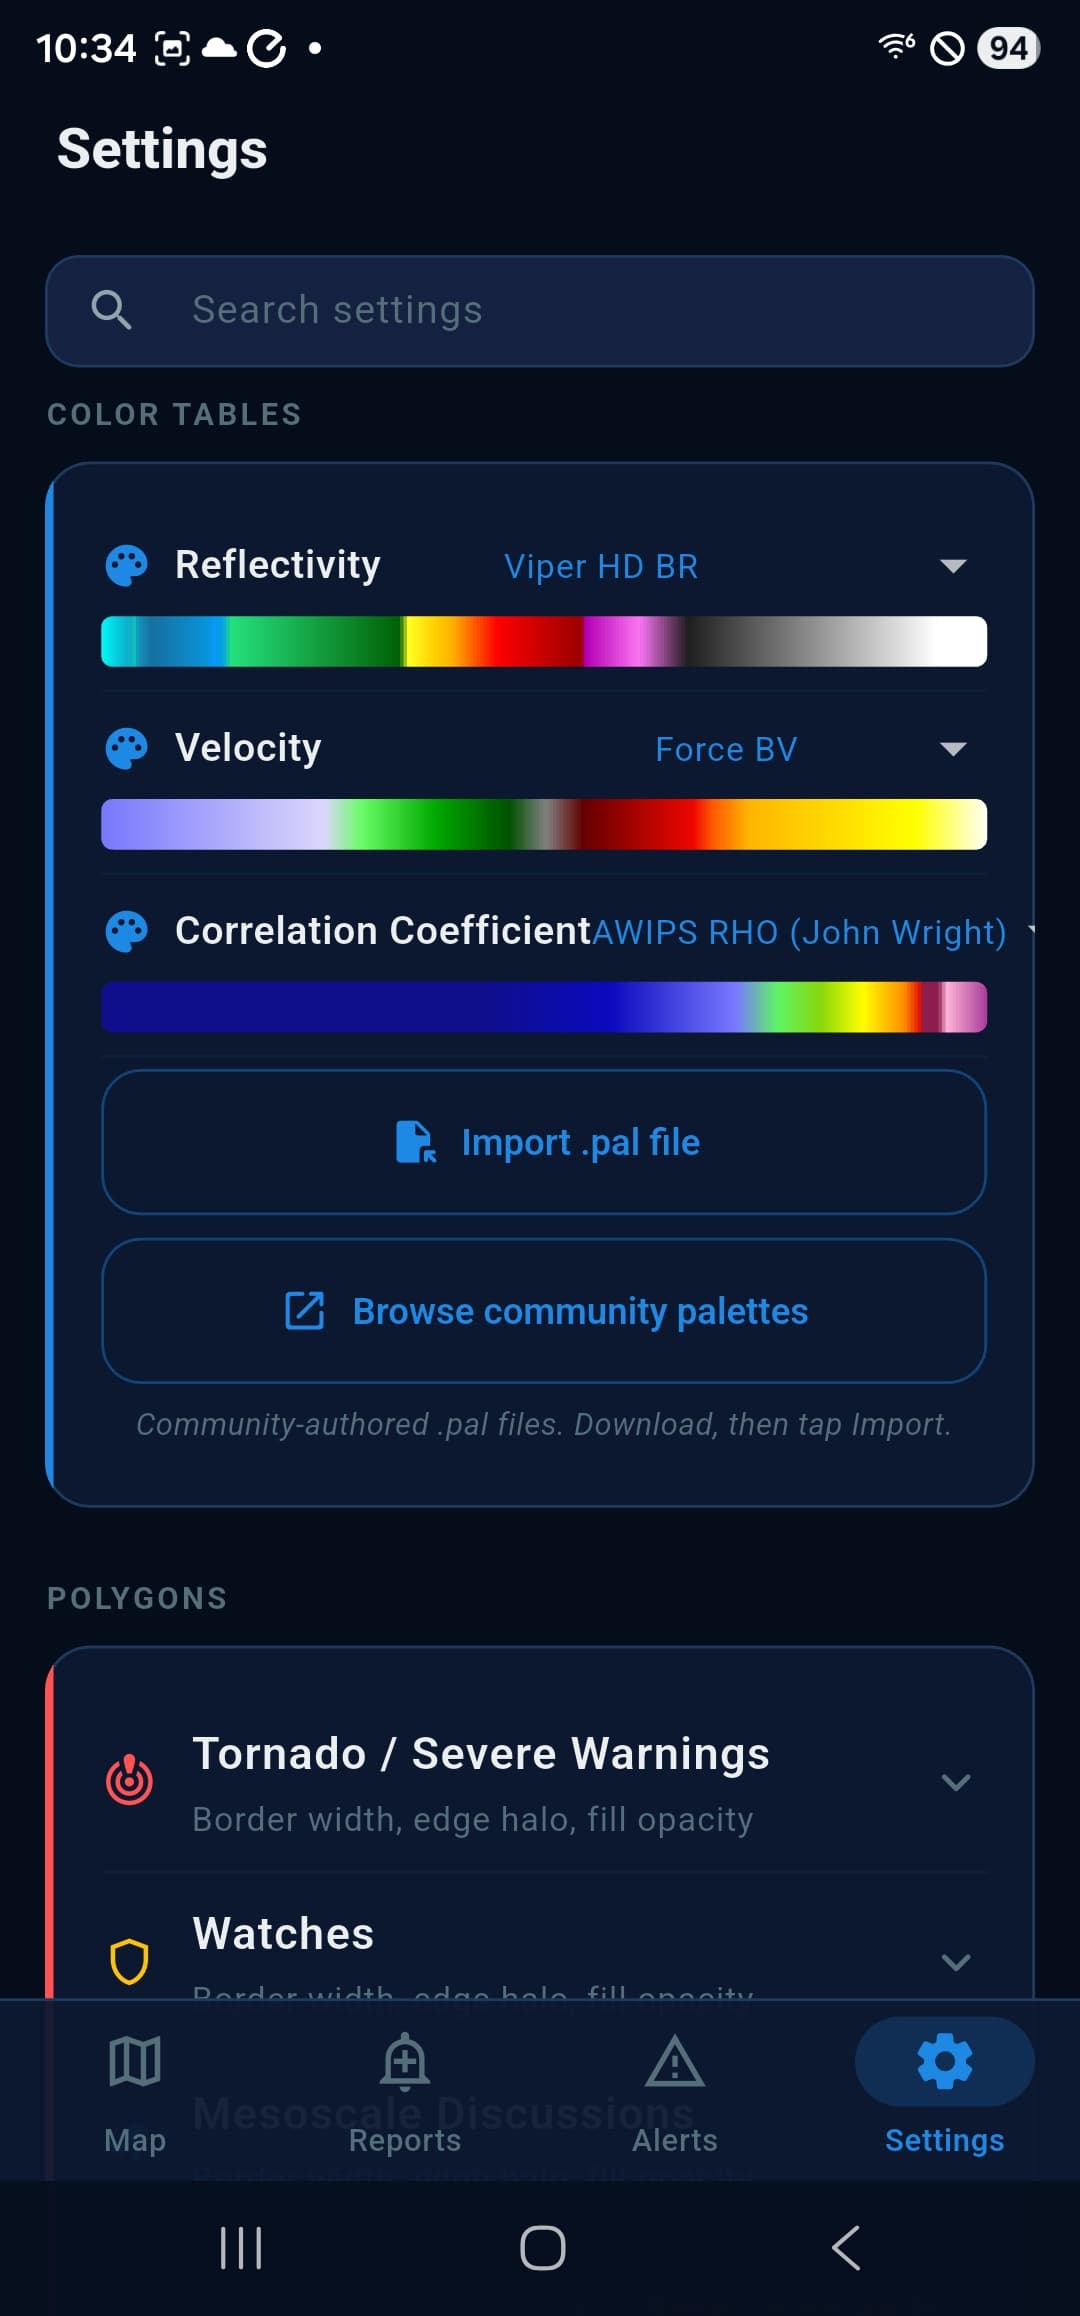
Color Tables
Sixteen built-in palettes, and your own
Spotter Tools Pro ships with sixteen GR2Analyst-style .pal color tables for Reflectivity, Velocity, and Correlation Coefficient.
If you've already got a palette you like, drop the .pal file in and it just works, same parser, same gradient logic.
- Reflectivity: 2004 LaCrosse, Apocs, Ben, Reflec 1, Viper HD, Macdonald-Emmerson
- Velocity: Alpha, A Mix of 2, AWIPS Evans, Force, GRL3 v2, Velocity 1
- Correlation Coefficient: AWIPS RHO, KK, CC 1, WKRN Nashville
- Import any GR2Analyst-format .pal file from device storage
- Per-product selection, different tables for BR, BV, and CC at the same time
Power-User Controls
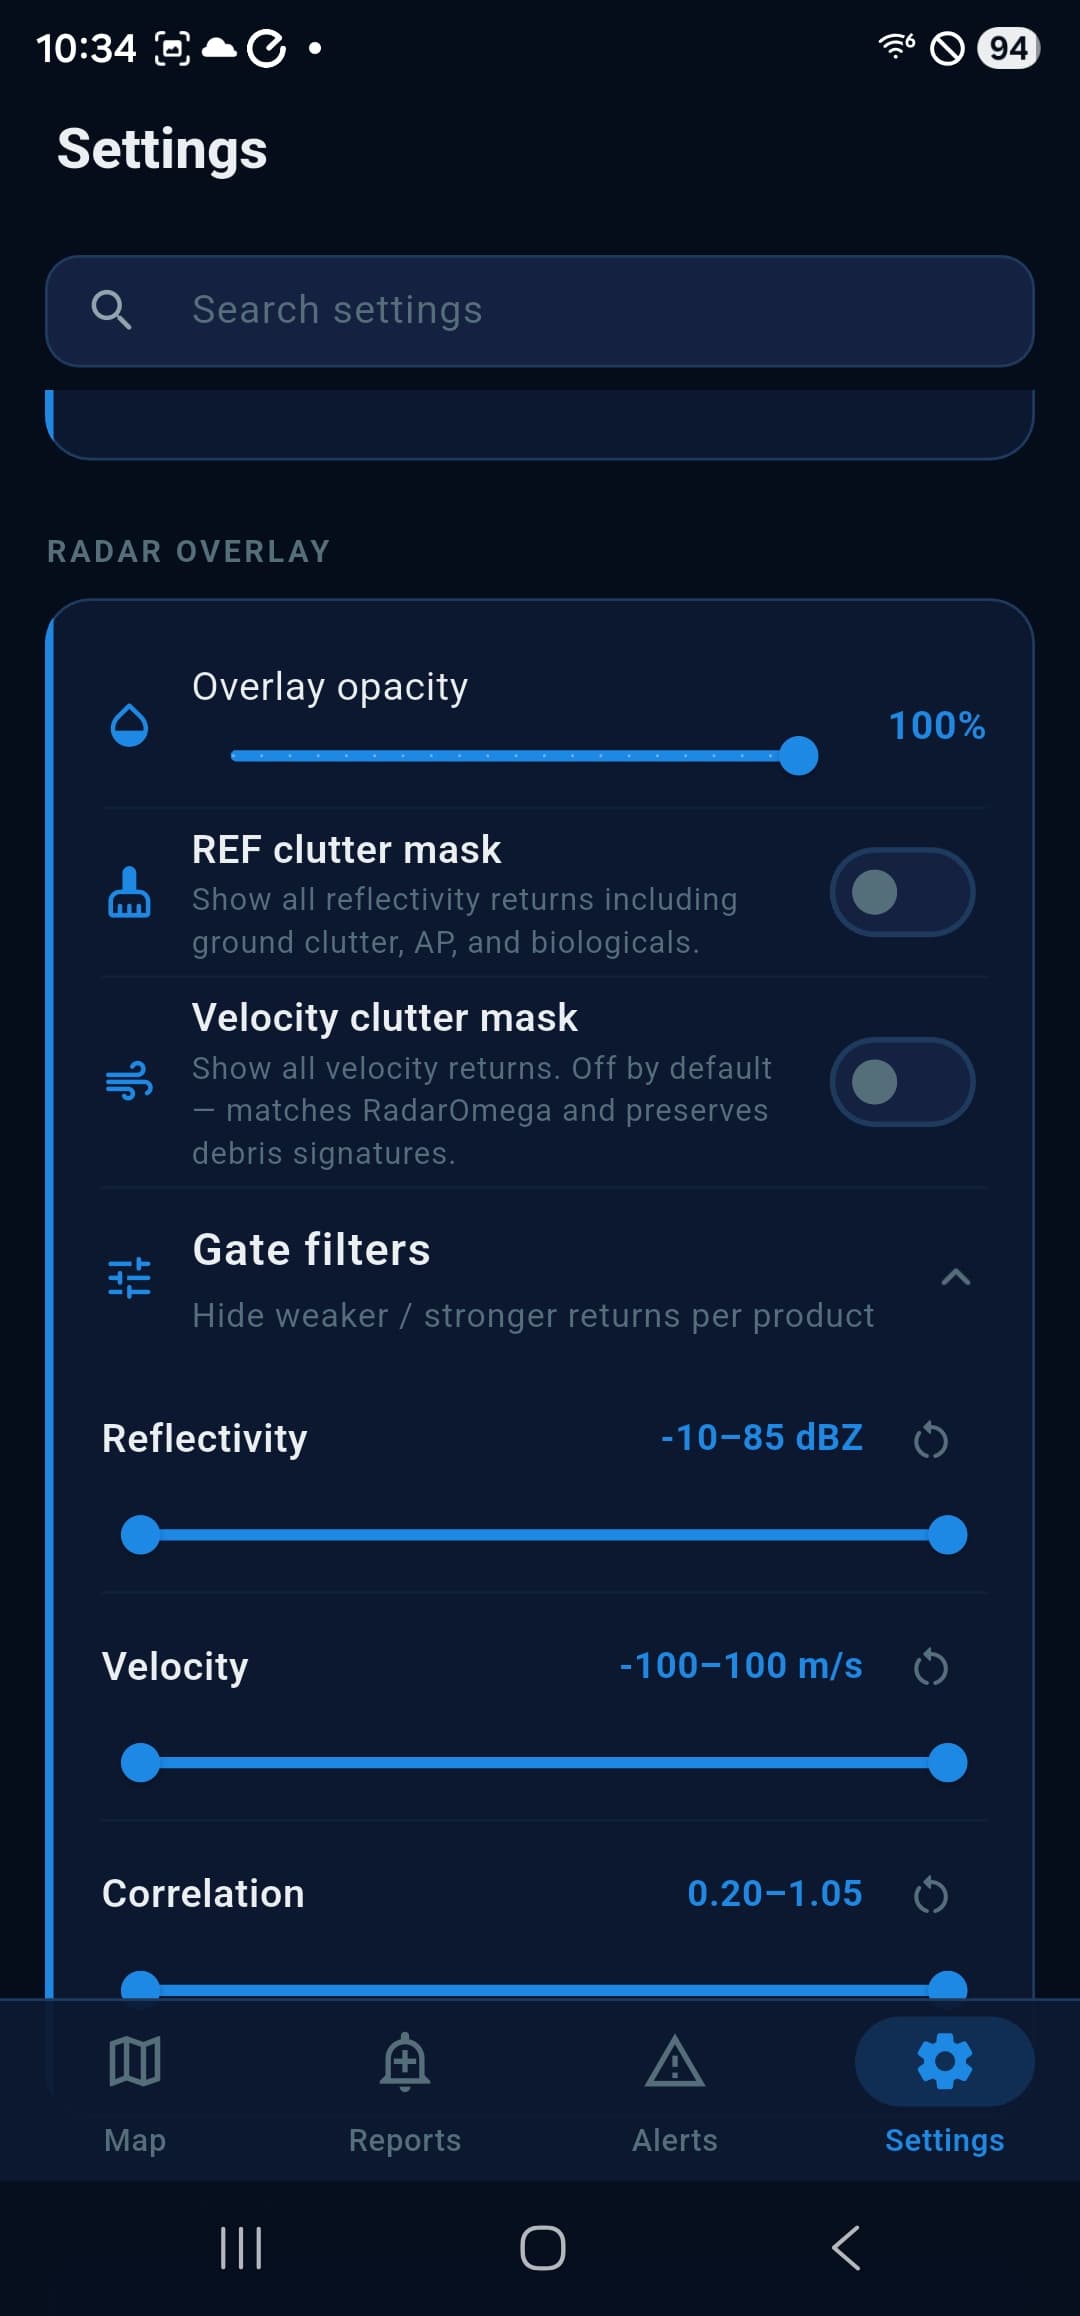
Overlay opacity, clutter masks, and gate filters
Tune the radar overlay to match the way you read radar, without compromising defaults that already work for most spotters.
- Overlay opacity slider so the basemap stays legible underneath
- Reflectivity clutter mask to surface ground clutter, AP, and biologicals when you want them
- Velocity clutter mask off by default, preserves debris signatures the way RadarOmega does
- Per-product gate filters for Reflectivity, Velocity, and Correlation Coefficient
Cross Sections
Slice a storm from the ground up
Draw a line across a storm and read a vertical slice through it. Instead of inferring structure from a flat top-down view, you see the core's height, how the echo leans, and where the strongest returns sit in the column.
It is backed by full-volume Level 2 decoding, so every tilt of the scan feeds the slice rather than just the lowest elevation.
Beam Height
Pitch the map and watch the beam rise
Separate from the 3D volume above, and useful for a different reason. Radar does not look straight ahead: the beam climbs as it travels, so a distant echo is sampled thousands of feet up while a nearby one is near the surface. Pitch the map and Spotter Tools Pro draws that geometry, lifting each sweep to its true height.
It makes beam overshoot obvious. At long range you are not looking at the storm's base, you are looking well up inside it, and this is the view that shows you by how much. On both iOS and Android.
Storm Cell Picker
Tap a cell, see the numbers
Tap any storm cell on the radar to read its identifier and key attributes, useful for cross-referencing the cell against an SPC mesoscale discussion or warning text.
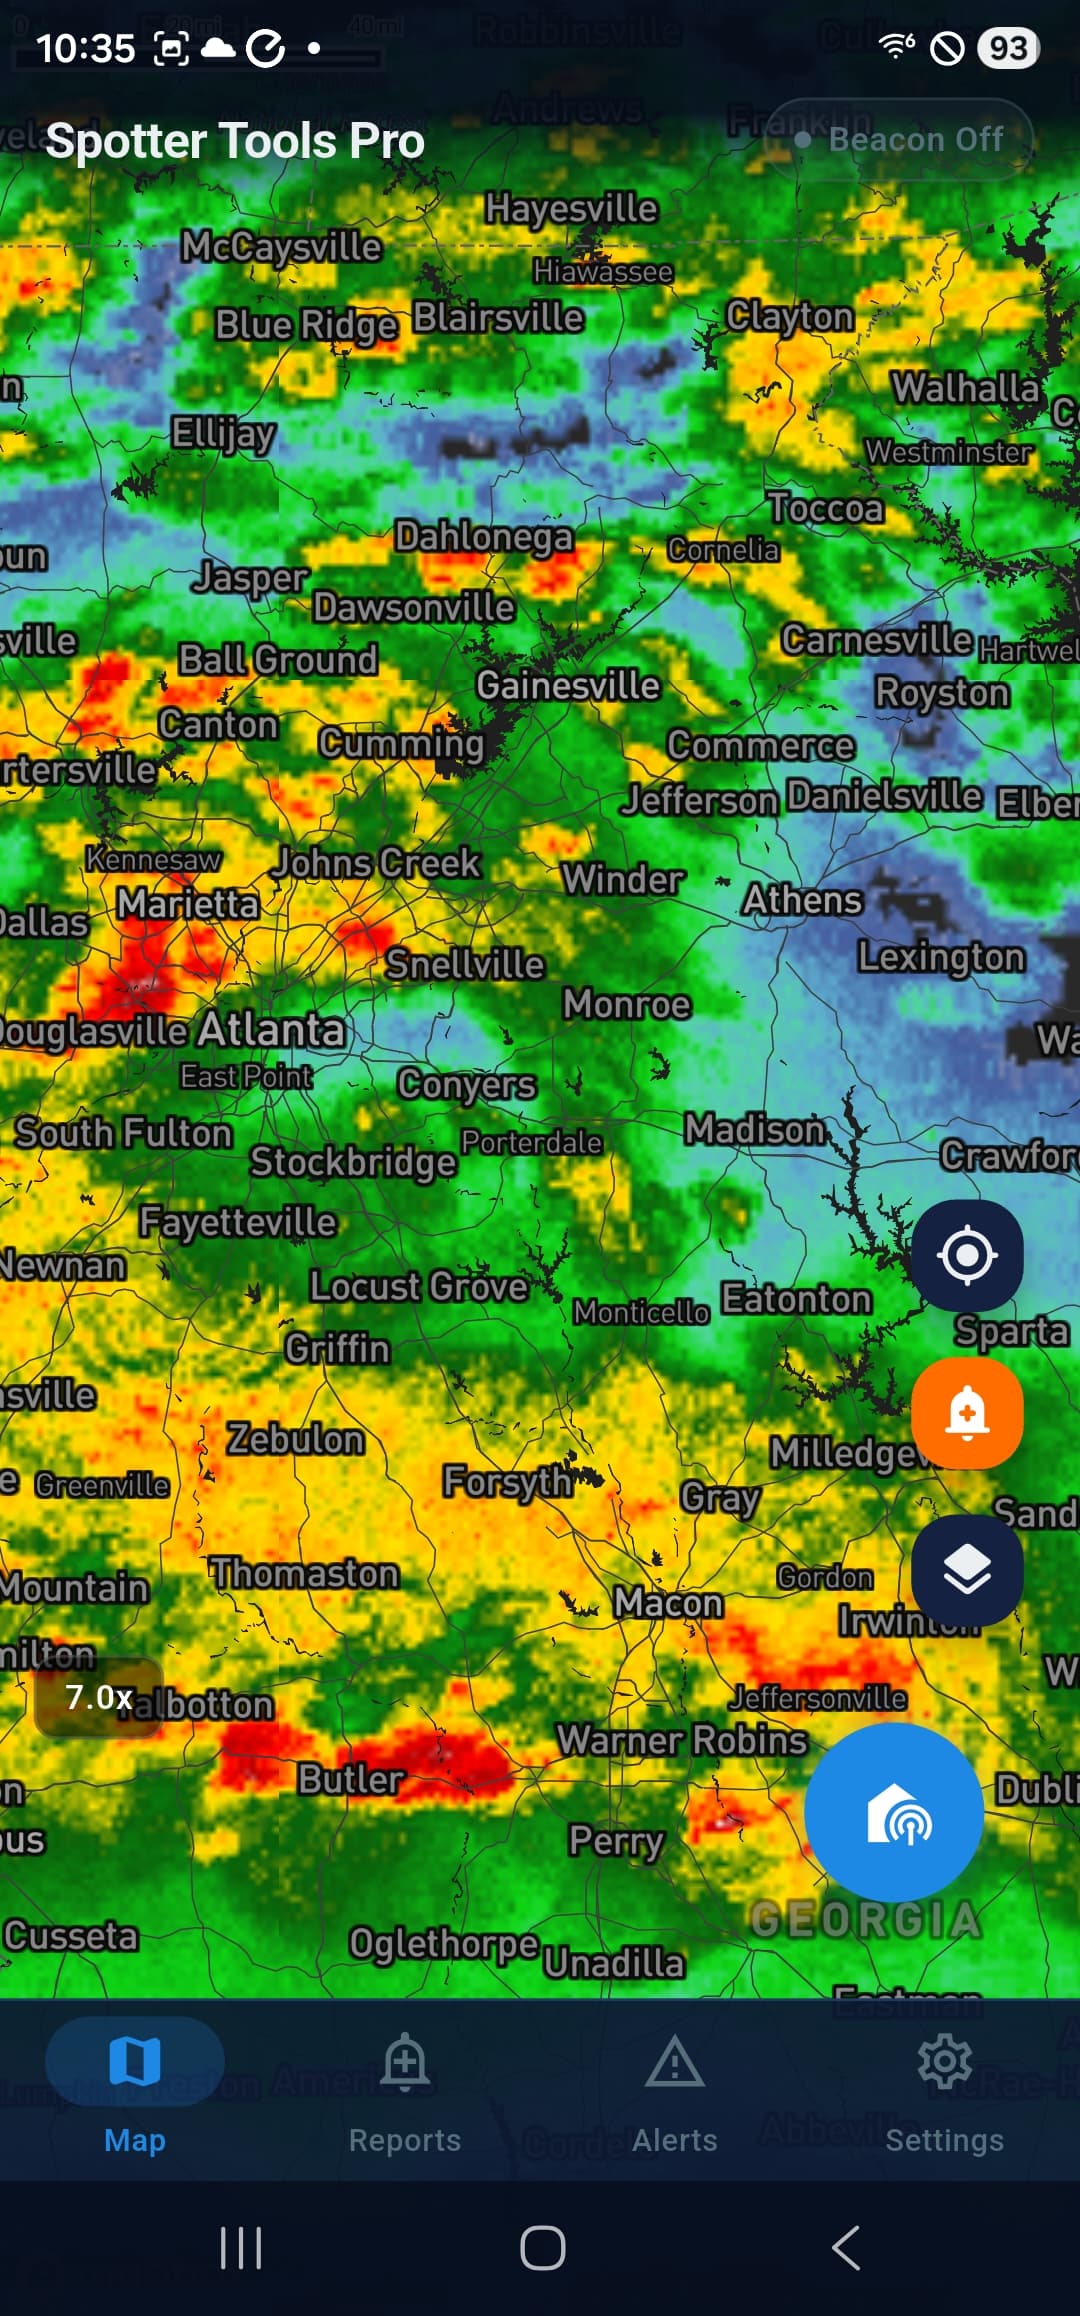
Composite
CONUS mosaic for the big picture
When you're trying to spot the next play across the Plains, the single-site view is the wrong tool. Toggle the composite radar layer for a full-CONUS reflectivity mosaic with selectable sources.
Composite and single-site can run side by side, single-site for tactical analysis, composite for situational awareness.
More than just radar
Pair the radar with smart push alerts that fire even when the app is closed, full NWS / SPC overlays, and one-tap severe weather reporting.