Full feature list
Everything in Spotter Tools Pro
One app, every tool. Everything below ships in the current build. Tap a deep-dive link for more on radar and alerts.
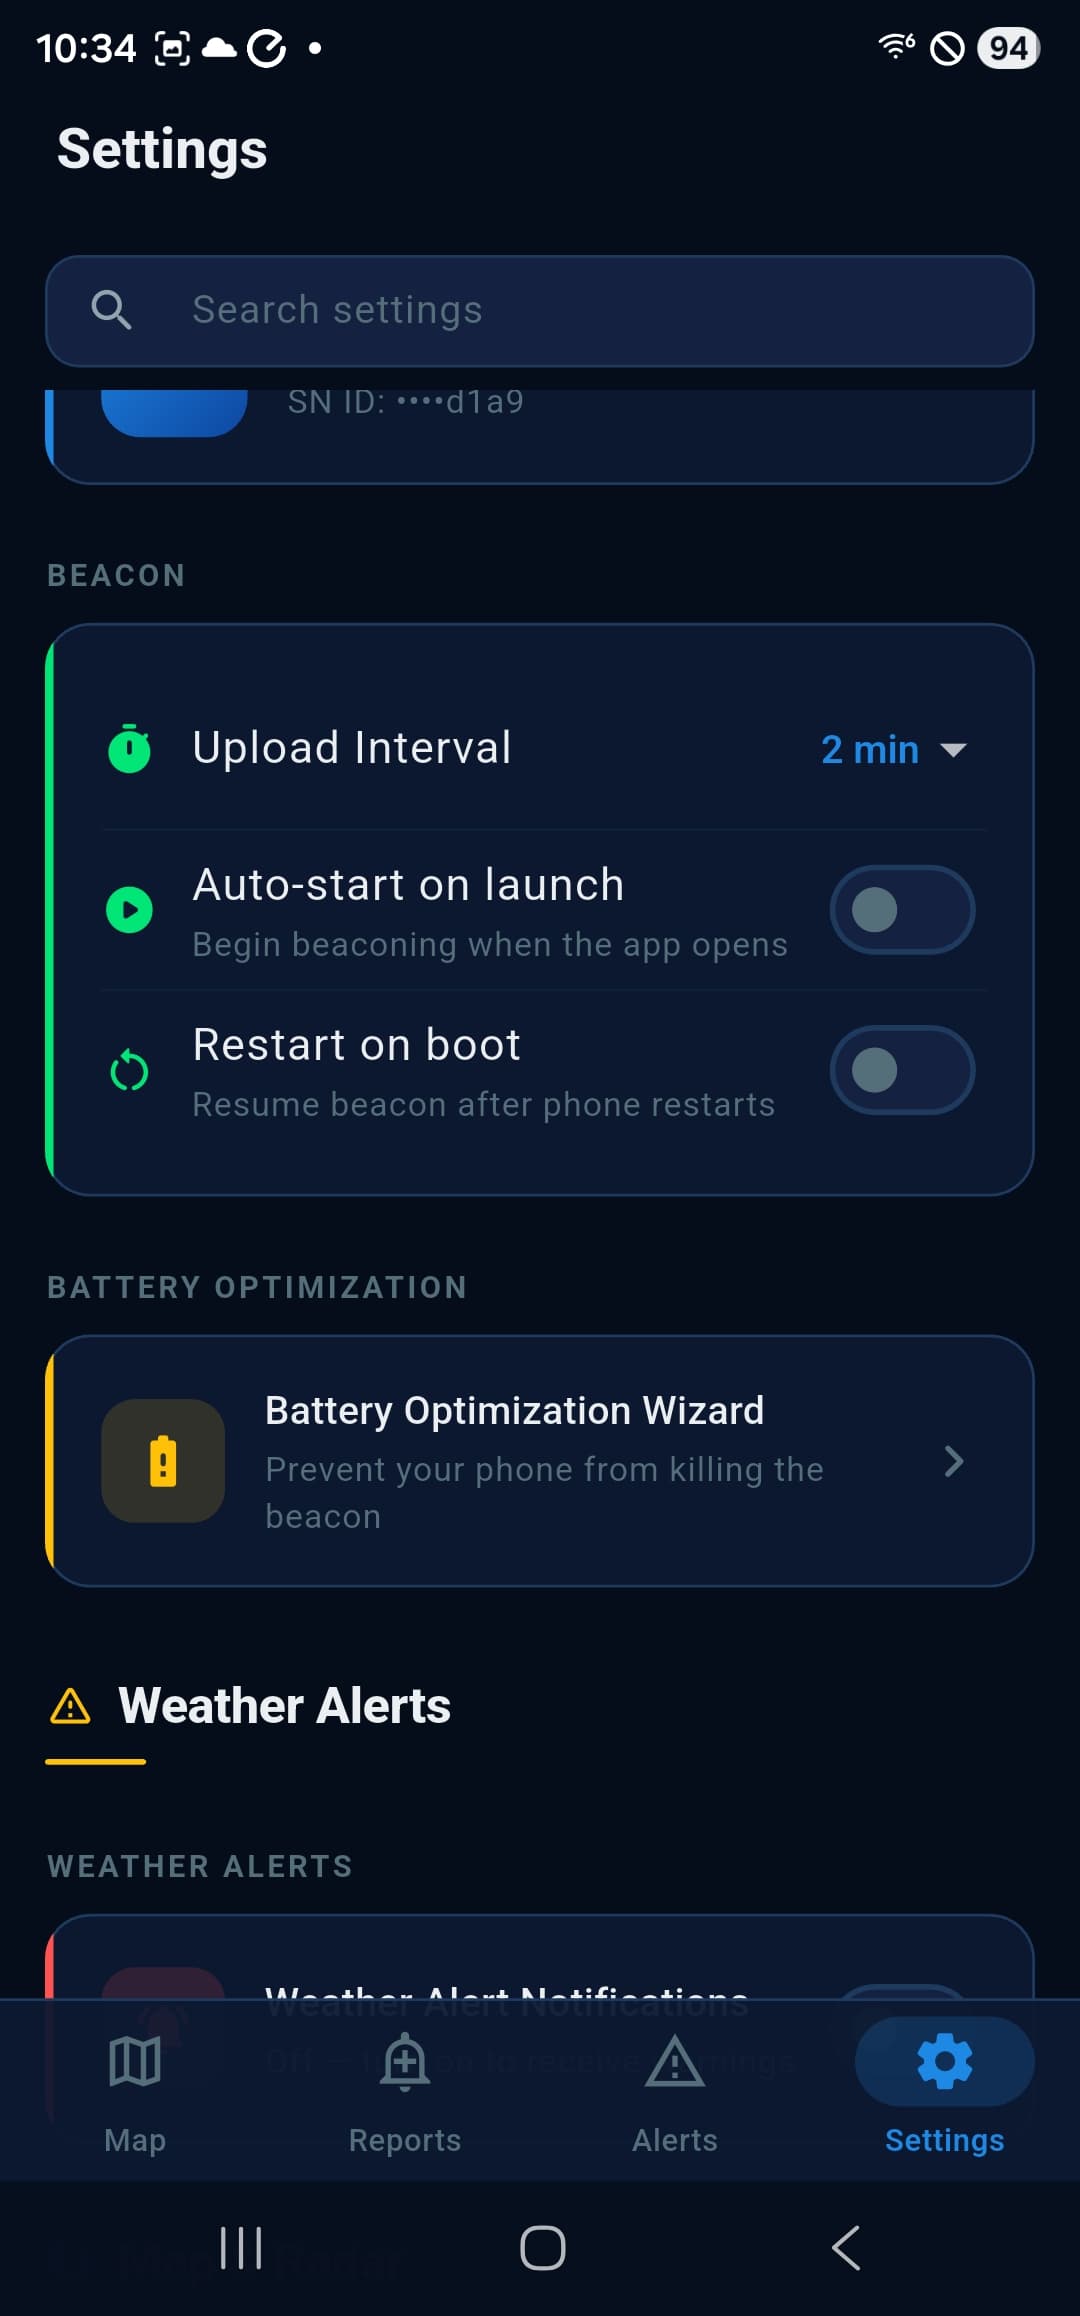
GPS & Beacon
Spotter Network Beacon
Transmit your position so the NWS and fellow spotters know where you are during severe weather.
Foreground & background beacon
A persistent foreground service keeps the beacon alive even when the screen is off, with a status notification you can tap to return to the map.
Configurable upload interval
Choose how often the app pushes your position to Spotter Network, balancing accuracy against battery.
Auto-restart on boot
Optional boot receiver brings the beacon back automatically after a device reboot so you never forget to turn it back on.
Sign in with your Spotter Network account
Use your Spotter Network username and password. No digging your App ID out of the SN dashboard to paste in, though that path is still there if you prefer it. Your own dot on the map is then matched exactly, so you always know which spotter is you.
Encrypted credential storage
Your Spotter Network application ID lives in encrypted device storage, never on a server we operate.
Battery optimization wizard
Built-in, device-specific instructions for Samsung, Xiaomi, OnePlus, Pixel, and more, so the OS doesn't kill the beacon in the background.
Map & Layers
The Map
A Mapbox-rendered tactical view with every layer a spotter needs, so you can toggle exactly what's on screen.
Active spotter markers
See every other Spotter Network beacon on the map with callsigns, vehicle info, and status.
NWS warnings & watches
Tornado, severe thunderstorm, flash flood, and fire warnings as full polygons, plus tornado / severe watch boxes.
NWS Local Storm Reports
Storm reports straight from the NWS offices that publish them, minutes fresh, covering every report type from tornadoes and hail to downed trees and flooding, with seven filter groups and times in your own clock.
Mesoscale discussions
Short-fuse SPC forecast areas (MCDs) and WPC Mesoscale Precipitation Discussions (flooding MPDs) overlaid as polygons, with full discussion text on tap.
Outlooks suite
SPC convective outlooks Day 1 through Day 8 (Categorical, Tornado, Wind, Hail), plus general thunderstorm, WPC Excessive Rainfall and QPF, Fire Weather, Winter Storm Severity (WSSI), CPC 6 to 10 day temperature and precipitation, and the Drought Monitor, switchable from a single sheet.
METARs
Live airport observations with selectable variables (temperature, dew point, wind, pressure, visibility) and unit pickers.
Surface observations (RTMA)
RTMA analyzed surface fields (temperature, dew point, theta-e, wind, and gusts) plus MRMS observed precipitation totals, all as true observations rather than forecast output.
Air quality (AirNow AQI)
EPA AirNow air quality on the map: Combined AQI, PM2.5, Ozone and PM10, with a 24-hour loop, a smooth contour surface, an EPA category legend, and NOAA analyst-drawn smoke plumes shaded underneath so smoke aloft shows where it adds something the surface number does not. Tap any monitor for its reading, a past-24-hours trend and the multi-day forecast for its area.
City & place search
Type any city, town, or landmark in the map menu and fly straight to it, no panning and pinching across the country.
One rail, not a wall of buttons
Every layer used to pin its own row of controls under the app bar and they stacked, eating a quarter of the screen. They now share one compact rail whose height stays fixed no matter how many layers you run.
One-tap base layer switching
A button in the bottom corner switches between the four layers that paint the map, single-site radar, composite, weather models, and satellite. It wears the icon of whatever is on screen, so it doubles as a status light.
Surface fronts & pressure
The WPC Coded Surface Bulletin drawn on the map with cold, warm, stationary, and occluded fronts plus high and low pressure centers.
Map style picker
Switch between basemap styles to match the conditions and your preference.
Offline basemaps
Download a map area before you head out and roads, town names and your GPS position keep working with no signal. Pick a centre from GPS or by searching, choose a radius and a detail level, see the size estimate, then download with live progress. Android and iOS.
A basemap roster that can grow
Eleven styles including our own Midnight, Blue Nav and Spotter Tools Grey, served from our backend so new basemaps arrive without waiting for an app update. Your Labels and Roads customisations still apply to whatever is pushed.
Measure distance
Drop points and read the distance and bearing between them, for sizing a hail swath or working out how far out a wall cloud is.
Mapbox location search
Geocode addresses, towns, and landmarks to jump anywhere on the map instantly.
Storm track projection
Draw the storm's leading edge and finish; that is the whole interaction. The motion comes off the radar, averaged across every tracked cell within forty miles of what you drew, so one decaying cell out front cannot drag the projection sideways. You get the swath, time marks across it, and every town in the path with its arrival time, from a 49,794-place gazetteer with a population floor of fifty, because the villages are the point. Arrival times count from the radar frame you drew on, not the wall clock.
Long-press context menu
Press and hold anywhere on the map for a quick menu: pull a point sounding, list the nearest radars, inspect that spot, or find the nearest cameras.
Turn the map, or lock it
Twist with two fingers to rotate, or hold the right mouse button and drag on Windows. It takes a deliberate twist, so a pinch with a wobble in it will not leave you sitting three degrees off, and there is a detent at north plus a lock button if you would rather it never turned at all. Chaser Mode still locks north up.
Radar
GPU Radar: Level 2, Level III & TDWR
Real, decoded NEXRAD in your hand, GPU-rendered and crisp at any zoom, now with a 3D storm volume you can fly around, WSR-88D Level III, dual-pol products, the full TDWR network, and dual-view split-screen compare.
3D storm volume
Every tilt of a Level 2 scan resampled into a single solid you can orbit, so you read how a storm is built instead of inferring it one elevation at a time. Debris and rotation are marked inside the storm, opacity follows rain rate so heavy cores stay solid while light rain goes sheer, height is yours to set including true scale, and the volume plays with the loop.
Nationwide 3D mosaic
The volume is not tied to one radar's umbrella. Switch to the national mosaic for the same solid anywhere in the lower 48 at about a two minute cadence. Site 3D and national 3D each carry their own opacity, so the mosaic can sit sheer for context under your own radar.
Volumes built on our servers
The prepared volume arrives ready to draw, so it appears almost immediately rather than after your phone has ground through a full scan. If none is available for your site, the app quietly builds one locally as before. The 3D chip only appears when your device can render it, and it always starts off so you never get a pitched 3D map you did not ask for.
NEXRAD Level 2 decoding
Reflectivity (BR), Velocity (BV), Correlation Coefficient (CC), Spectrum Width, and Storm-Relative Velocity decoded directly from raw Level 2 data, no third-party tile server.
Instant Level 2, six products
Six Level 2 products paint in about a second rather than after a full scan download: reflectivity, velocity, correlation coefficient, spectrum width, storm relative velocity and normalized rotation. The scan time and VCP are printed on the panel so you know how old the picture is, and if the fast lane is ever slow the app falls back to the full on-device decode.
GPU-rendered, sharp at any zoom
A native GPU custom layer (OpenGL on Android, Metal on iOS) draws radar crisply at any zoom level, no blocky pre-baked tiles.
WSR-88D Level III & dual-pol
RPG-processed super-resolution Level III velocity and reflectivity, plus dual-pol products: Differential Reflectivity (ZDR), Correlation Coefficient (CC), Specific Differential Phase (KDP), and Hydrometeor Classification.
TDWR terminal radar
The complete 45-site Terminal Doppler Weather Radar network at high resolution, extra low-level detail near major metro areas, with looping just like the WSR-88D sites.
Level III storm attributes
Overlay NWS Level III storm tracks, mesocyclone rotation, and Tornado Vortex Signature (TVS) markers on single-site radar to see where cells are headed and where rotation is tightening.
More single-site products
Vertically Integrated Liquid (VIL), Digital Precipitation Rate, Normalized Rotation, Max Reflectivity, Min Correlation Coefficient, and 1-hour and storm-total precipitation, alongside the base moments.
Vertical cross sections
Draw a line across a storm and read a vertical slice through it, so you can see the structure from the ground up instead of only the view from above. Backed by full-volume Level 2 decoding, so every tilt of the scan is available.
Beam-height tilt
Separate from the 3D volume, and useful for a different reason. Pitch the map and the radar beam climbs with distance, the way the real beam does, which makes overshoot obvious: at long range you are not looking at the storm's base, you are looking well up inside it.
FastScan sweep & range rings
A live sweep beam with your choice of colors, plus range rings labeled in miles with adaptive coloring so they stay readable over any product.
VAD Wind Profile
Open a VAD Wind Profile (VWP) panel from any radar-site pin to read the wind profile derived from the radar's velocity data.
Composite radar mosaic
A GPU-rendered CONUS composite, crisp at every zoom, drawn in data space from the full MRMS product catalog, with a transport bar, hourly playback, and tap-to-read values.
Full animation transport
Play, pause, scrub, change loop speed, and pick frame count, same controls you'd expect from a desktop radar app.
Loops about eight hours deep
Level III loops now offer 48, 72 and 96 frames. Frames are held in a compact form and expanded only when they are shown, so a deep loop fits in memory, loads faster and plays smoothly instead of being thinned down to a handful of frames.
FastScan sweep (optional)
An optional beam-reveal sweep animation with range rings and live pipeline status chips, off by default and switchable in settings.
Dual-view split-screen
Compare two radar views side by side (different products or two sites), each pane with its own independent controls.
Custom GR2Analyst-style color tables
Sixteen built-in .pal palettes for BR, BV, and CC, plus drop-in import for your own .pal files.
Storm cell picker
Tap any storm cell on the radar to see its identifier and attributes pulled from the radar product.
Storm cell deep dive
Expand any cell into a full readout: rainfall rate, peak reflectivity, storm-top height, footprint, mass and volume, an age tracker, and at-a-glance severe indices.
Mesoanalysis layer
SPC-style severe-weather parameters under the radar (CAPE, shear, storm-relative helicity) plus derived composites like Supercell and Significant Tornado, sampled anywhere with a bilinear crosshair readout.
Per-site selection
Pick the closest WSR-88D site automatically, or choose a specific site to focus on, useful when chasing the edge of coverage.
Time Travel
The Radar Archive
The map has a second clock. Pick a date and a time and the radar loads as it was at that instant, so you can walk back through an event you missed or study one you did not.
Scrub back to any date and time
Level 2 reaches back to June 1991 and Level III to May 1992, so Moore, El Reno and Bridge Creek all load. Coverage thins the further back you go, the app says when a radar recorded nothing, and the picker shows the download size before you spend it.
Storm tracks and mesocyclones come with it
The archive is not just the reflectivity image. Storm cell tracks and mesocyclone markers load at the same instant, so the whole picture agrees with itself.
Enter the time in the zone you are thinking in
Looking up a 6:42 PM Central event from Mountain time is the normal case, not the exception. Pick Central, type 6:42 PM, done. Local, UTC, Eastern, Central, Mountain, Arizona, Pacific, Alaska and Hawaii, with Arizona and Hawaii broken out because they skip daylight saving. A same-moment line always cross references UTC and your own zone, carrying the date as well as the time.
A mode, not a layer
One clock governs everything that has history, so nothing drifts out of sync. Layers with no archive behind them switch off rather than sitting on live data under a past-tense banner, and an amber banner with a Return to Live button rides the top of the map the whole time.
Every reading follows the clock
Storm-relative velocity subtracts the storm motion measured at that time rather than today's, the cross section builds only from tilts belonging to that scan, and archived Level II velocity is unfolded against the wind profile measured from the archived scan itself.
The sweep stops
The beam that paints gates in as it passes them is a claim that data is arriving right now. Over a scan from two years ago it is simply false, so it goes off with the rest of the live-only chrome.
Markup
Draw on the Map
Mark up the map the way you would a paper chart, with every shape anchored to the ground instead of the screen so it stays where you put it.
It stays where you drew it
Circle a hook echo, pan half a county, and the circle is still on the hook echo. Every shape stores real coordinates and survives pan, zoom, rotate and tilt.
Freehand, lines, arrows, boxes and circles
With a contrast halo on by default, so a stroke stays readable even where it crosses a 65 dBZ core.
Eleven forecaster presets
Warm, cold, stationary and occluded fronts with correct pips, plus outflow boundary, dryline, rotation, hail core, damage corridor, target box and escape route. Pips sit on the side the boundary is advancing into, worked out from the shape of the line rather than which end you started from.
Edit anything you have drawn
Select a shape to move it, drag its vertices, resize it, add a text label, or change dash, opacity, fill and stacking order. Fifty levels of undo and redo behind you.
Every shape measures itself
Length and bearing, radius, dimensions, area, corridor width in miles. So you can draw the thing you just measured.
Saved, and shareable
The current sketch autosaves and comes back on launch, there is a named library to save and reopen your work, and you can export as a PNG or as GeoJSON.
Hand a drawing to Storm Track
Draw a line and it becomes the storm's leading edge; draw an arrow and it becomes the motion. The projection maths stays in one place instead of being reinvented here.
Beyond the Storm
Wildfires & Earthquakes
Severe weather is not the only thing worth watching. Both layers are off by default and both can alert you.
Active wildfire incidents
NIFC WFIGS incidents, fed by IRWIN so state agency fires are covered too, with optional burn perimeters. Tap a fire for acreage, containment, cause, behaviour, crew size, complexity, managing team, fuel, cost to date and distance from you.
Satellite thermal hotspots
NASA FIRMS detections as tappable dots, sized by fire radiative power so the burning cores stand out of the scatter, with brightness temperature, satellite, day or night pass and footprint on tap. Fire cards also carry a satellite activity summary: detections in the last 24 and 6 hours, peak radiative power and the latest pass.
Worldwide earthquakes
Straight from the USGS real-time feeds, with the magnitude printed inside every dot and a pickable magnitude floor and time window. Tap one for depth, timing, distance from you, felt reports, PAGER alert level, tsunami zone and review status.
Felt range, measured where it exists
A dashed ring is our estimate of where the quake was perceptible. A solid contour is the real USGS ShakeMap, fetched when you tap an event, and it replaces the estimate rather than drawing alongside it. The map always tells you which one you are looking at.
Live Cameras
Traffic & Sky Cameras
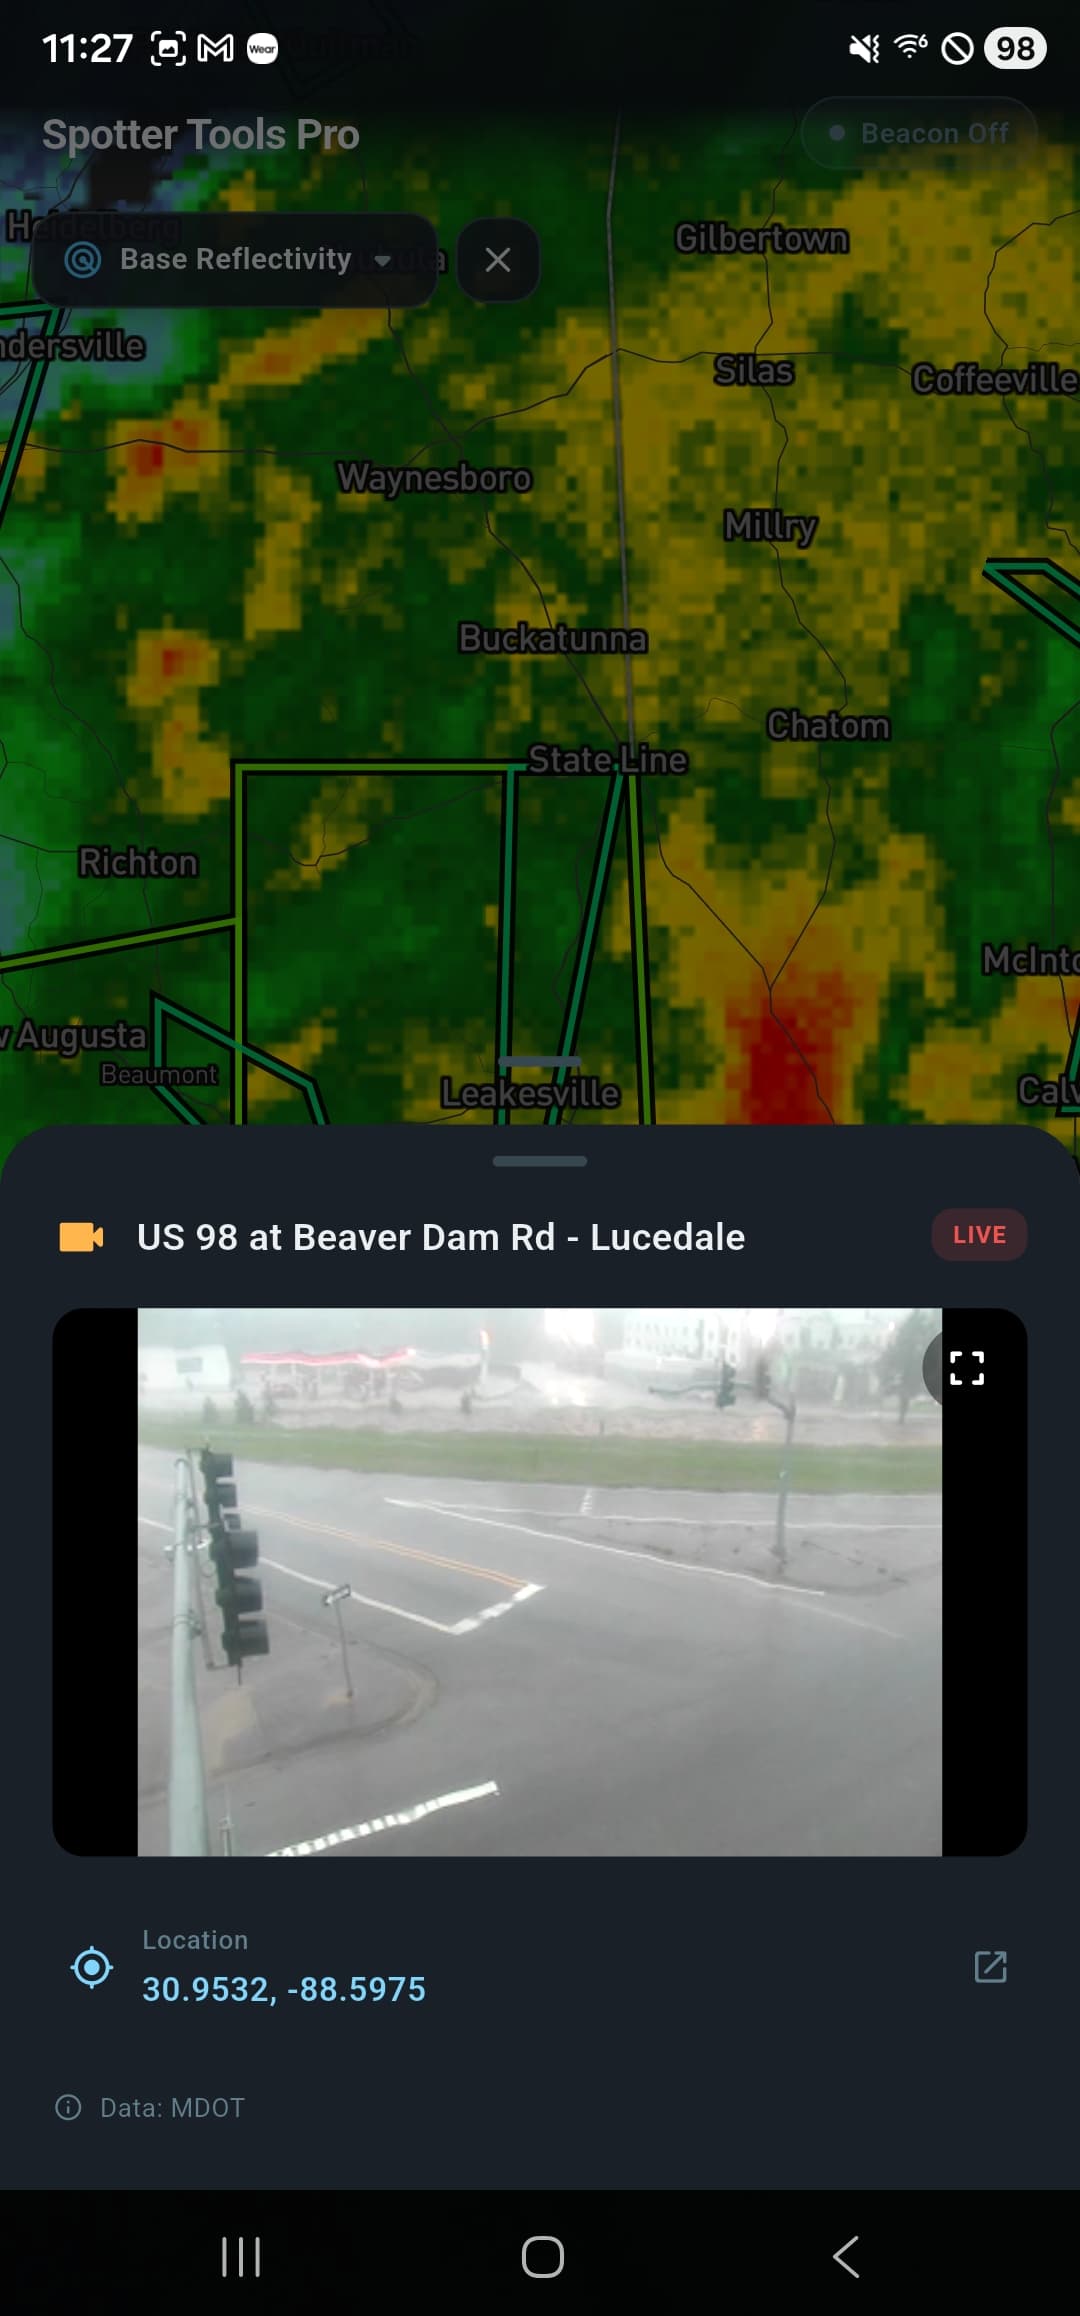
See conditions on the ground with tens of thousands of cameras on the map, with live video where the agency streams it.
48 states of DOT traffic cameras
State transportation cameras coast to coast, live HLS video where the agency offers it, frequently-updated stills where it doesn't. 61 sources in all, and new ones reach you without waiting for an app update.
Beyond the highways
FAA WeatherCams, Windy community webcams, NOAA offshore buoy cams, USGS volcano cams, USGS river cams, National Park vista cams, ALERTWildfire fire-watch cameras, and the Kentucky Mesonet's 78 statewide weather cameras.
Fullscreen & direction-aware
Watch any feed fullscreen, and map icons point the direction each camera faces so you know what you're about to see.
Choose your sources
Pick exactly which states and agencies appear on the map from a single Camera Sources sheet, keeping it focused on your area.
Readable in a dense metro
An amber video badge marks a live feed and a blue-grey photo badge marks stills, so you know before you tap. Cluster bubbles are small and translucent rather than solid discs, and a Group nearby cameras switch lets you turn clustering off entirely when you want every camera in a metro shown individually.
Live Chasers
Live Storm Chasers
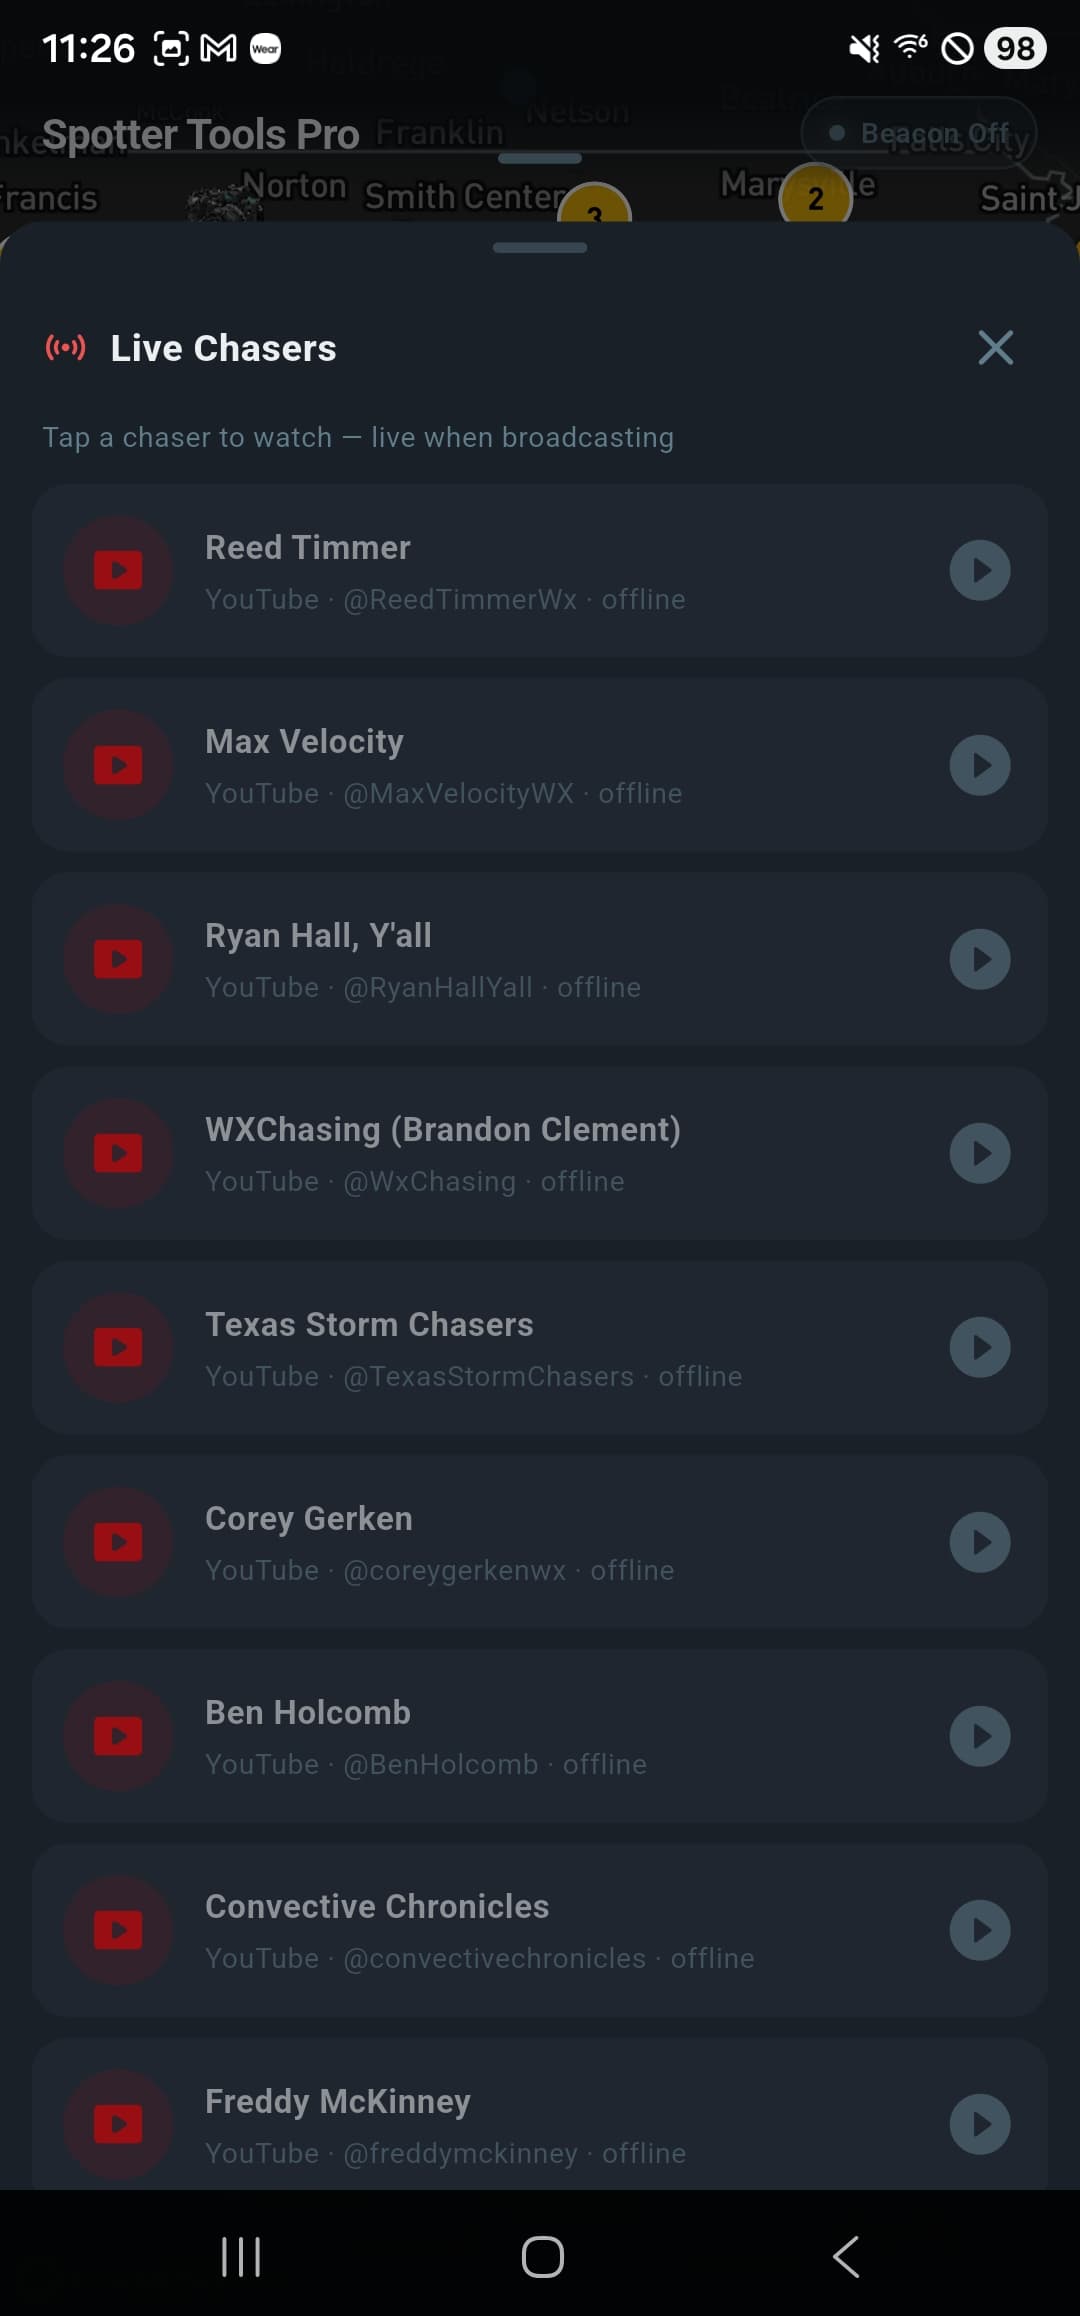
Watch the chase as it happens, with major storm chasers streaming live from the field, without leaving the app.
In-app live streams
YouTube and Facebook Live embeds play right on top of the map, no app-switching to follow the action.
A roster of well-known chasers
Reed Timmer, Ryan Hall Y'all, Max Velocity, WXChasing, Corey Gerken, Texas Storm Chasers, and more, curated in one panel.
Real-time LIVE badges
The app checks who's broadcasting and surfaces live streams first, so you always land on someone actually on a storm.
Weather Models
Forecast Model Guidance
Look ahead with high-resolution model output overlaid right on the map.
HRRR, GFS & RRFS overlays
Pull HRRR, GFS, and RRFS guidance directly onto the map: reflectivity, 2 m temperature, wind, CAPE, precipitation, and more.
A picker that groups by region
CONUS, Global, Ensembles, Tropical, Europe, Asia, Marine and Air Quality, served from our backend so new models appear without an app update. NAM, ECMWF and ICON-D2 sit alongside the CONUS three.
Sub-hourly runs
Support for 15-minute models, so a run that publishes every quarter hour can be scrubbed frame by frame instead of collapsed to the hour.
A legend for every product
Every colour ramp is mirrored from the source table, so the strip beside the map matches the pixels on it.
Animated time bar
Scrub through forecast hours with a time bar and color legend to watch a system evolve before it arrives.
On-map control chips
Quick chips switch model, product, and run without digging through menus.
Point Forecast & Widget
The Forecast for Any Spot
Tap anywhere for the full National Weather Service forecast for that exact point, then put it on your home screen.
Tap, long-press, or search
Open a forecast from a long-press on the map, the map menu, or the city search. It works for any coordinate, not just named places.
Conditions, periods, and the forecaster's words
Live conditions from the nearest airport station, an alert banner when something is active, and the day and night periods with the written forecast exactly as the office issued it.
48 hour trend chart
A temperature trend over a tappable hour-by-hour strip, so you can read the shape of the next two days at a glance. The strip labels the day at the start and at every midnight, so a long scroll never leaves you guessing which day you are on.
Dates, wind and trends on the cards
Every period carries its date, on the rail and in the list. Wind is on the card, with a rising or falling temperature arrow when the office flags one, and rain chance is always drawn, so a dry day between two wet ones reads as a clear 0% rather than nothing at all.
The Area Forecast Discussion
The local office's own reasoning, in their words, right in the sheet. No hunting for it on a separate site.
Every grid layer, explained
A detail grid exposing everything the office publishes for that cell, including thunder probability, mixing height, transport wind, wet bulb globe temperature and the Haines index. Tap any value for a plain English explanation of what it means and why it matters.
Readable offline
The last forecast is kept on device, so you can still read it when you lose signal in the field.
Home screen widget
Put the forecast for any place on your home screen. Choose the location, whether to show the next few hours, the next few days, or both, and match it to the app's theme or pick your own. An optional strip appears when a warning or watch covers that spot.
Lightning, Satellite & Tropical
Lightning, Satellite & Tropical
Three new layers for the full atmospheric picture: strike-by-strike lightning, satellite imagery, and tropical tracking.
Live lightning (GOES GLM)
Real-time GOES Global Lightning Mapper strikes on the map, with an adjustable display window, bolt size, radar-loop sync, and a flash glow as new strikes land.
GOES East & West satellite
GOES-East and GOES-West imagery (Infrared, Water Vapor, Visible, and GeoColor) with a radar-synced cloud loop, GPU cross-fade animation, on-map product chips, and a freshness readout that names the lagging satellite. Drop it under the radar with adjustable opacity.
Full NESDIS sector list
The region picker carries NESDIS STAR's own sector layout, 22 GOES-East regions and 12 GOES-West, in a two-level picker grouped by spacecraft.
Pacific coverage, basin to landfall
Himawari GeoColor across the typhoon basin, with the northwest Pacific region widened to keep the East China Sea approach in frame and dedicated Japan and Philippines sectors for a sharper landfall view. The central Pacific region reaches 30 North, so a recurving hurricane stays on screen. Imagery courtesy of CIRA.
Worldwide tropical & hurricane tracking
Named storms in every basin (typhoons too) via a global feed, plus NHC outlook areas-to-watch, forecast cones, tracks, intensity, and the observed past track. Tap any storm for a detail card.
Wind
Live Wind Flow
Real surface wind, rendered as thousands of flowing particles, an instant read on outflow, convergence, and where it's really blowing.
Animated particle flow
Live RTMA surface wind drawn as comet-like particles streaming across the map, colored by speed (blue → green → orange → red).
GPU-rendered, smooth at any zoom
A native GPU custom layer (OpenGL on Android, Metal on iOS) keeps the flow fluid, with zoom-scaled trails and particle density.
Read the wind at a glance
See boundaries, convergence, and gradients without reading a number, then drop radar or lightning on top for the full picture.
Soundings
On-Device Soundings
Full atmospheric profiles without a desktop: skew-T, hodograph, and complete sounding analysis, right on your phone.
Skew-T & hodograph
Read the vertical profile the way forecasters do, a skew-T log-P diagram and hodograph, rendered on-device.
Full sounding analysis
Derived parameters and a complete sounding breakdown to size up instability, shear, and storm potential at a glance.
Observed + forecast profiles
Pull observed balloon data or HRRR forecast profiles for a point, the current state or the hours ahead, and scrub through hourly frames.
GFS for the places HRRR does not reach
GFS joins the model picker as the coverage model, so Alaska, Hawaii, Puerto Rico and offshore points get a sounding where the high-resolution models have no data.
Plain-language read
A written interpretation of the profile, including what happens to storms moving into the area rather than only whether new storms can fire. A capped sounding no longer makes an inbound mature storm look doomed, since inhibition guards initiation, not an established updraft. Adds a dry-microburst callout and handles high-shear low-CAPE setups.
Alerts & Notifications
Smart Push Alerts
An on-device watch worker fires NWS warnings even when the app is closed, with the controls a chase op-center actually needs.
Background watch worker
A foreground service watches the NWS alerts feed and posts notifications without needing a cloud account.
Custom watch zones
Track your current location, a fixed home zone, custom counties / forecast zones, or any combination at once.
SPC outlooks matched to your zones
An outlook notification describes the risk over your own watch zones rather than the highest risk anywhere in the country, and tapping it turns the outlook layer on and flies you to your strongest zone. A nationwide zone no longer means the whole country for outlooks, and a setting brings the old behaviour back if you want it.
Population inside the polygon
Each warning shows an estimated number of people inside the polygon, so you can gauge the potential impact at a glance.
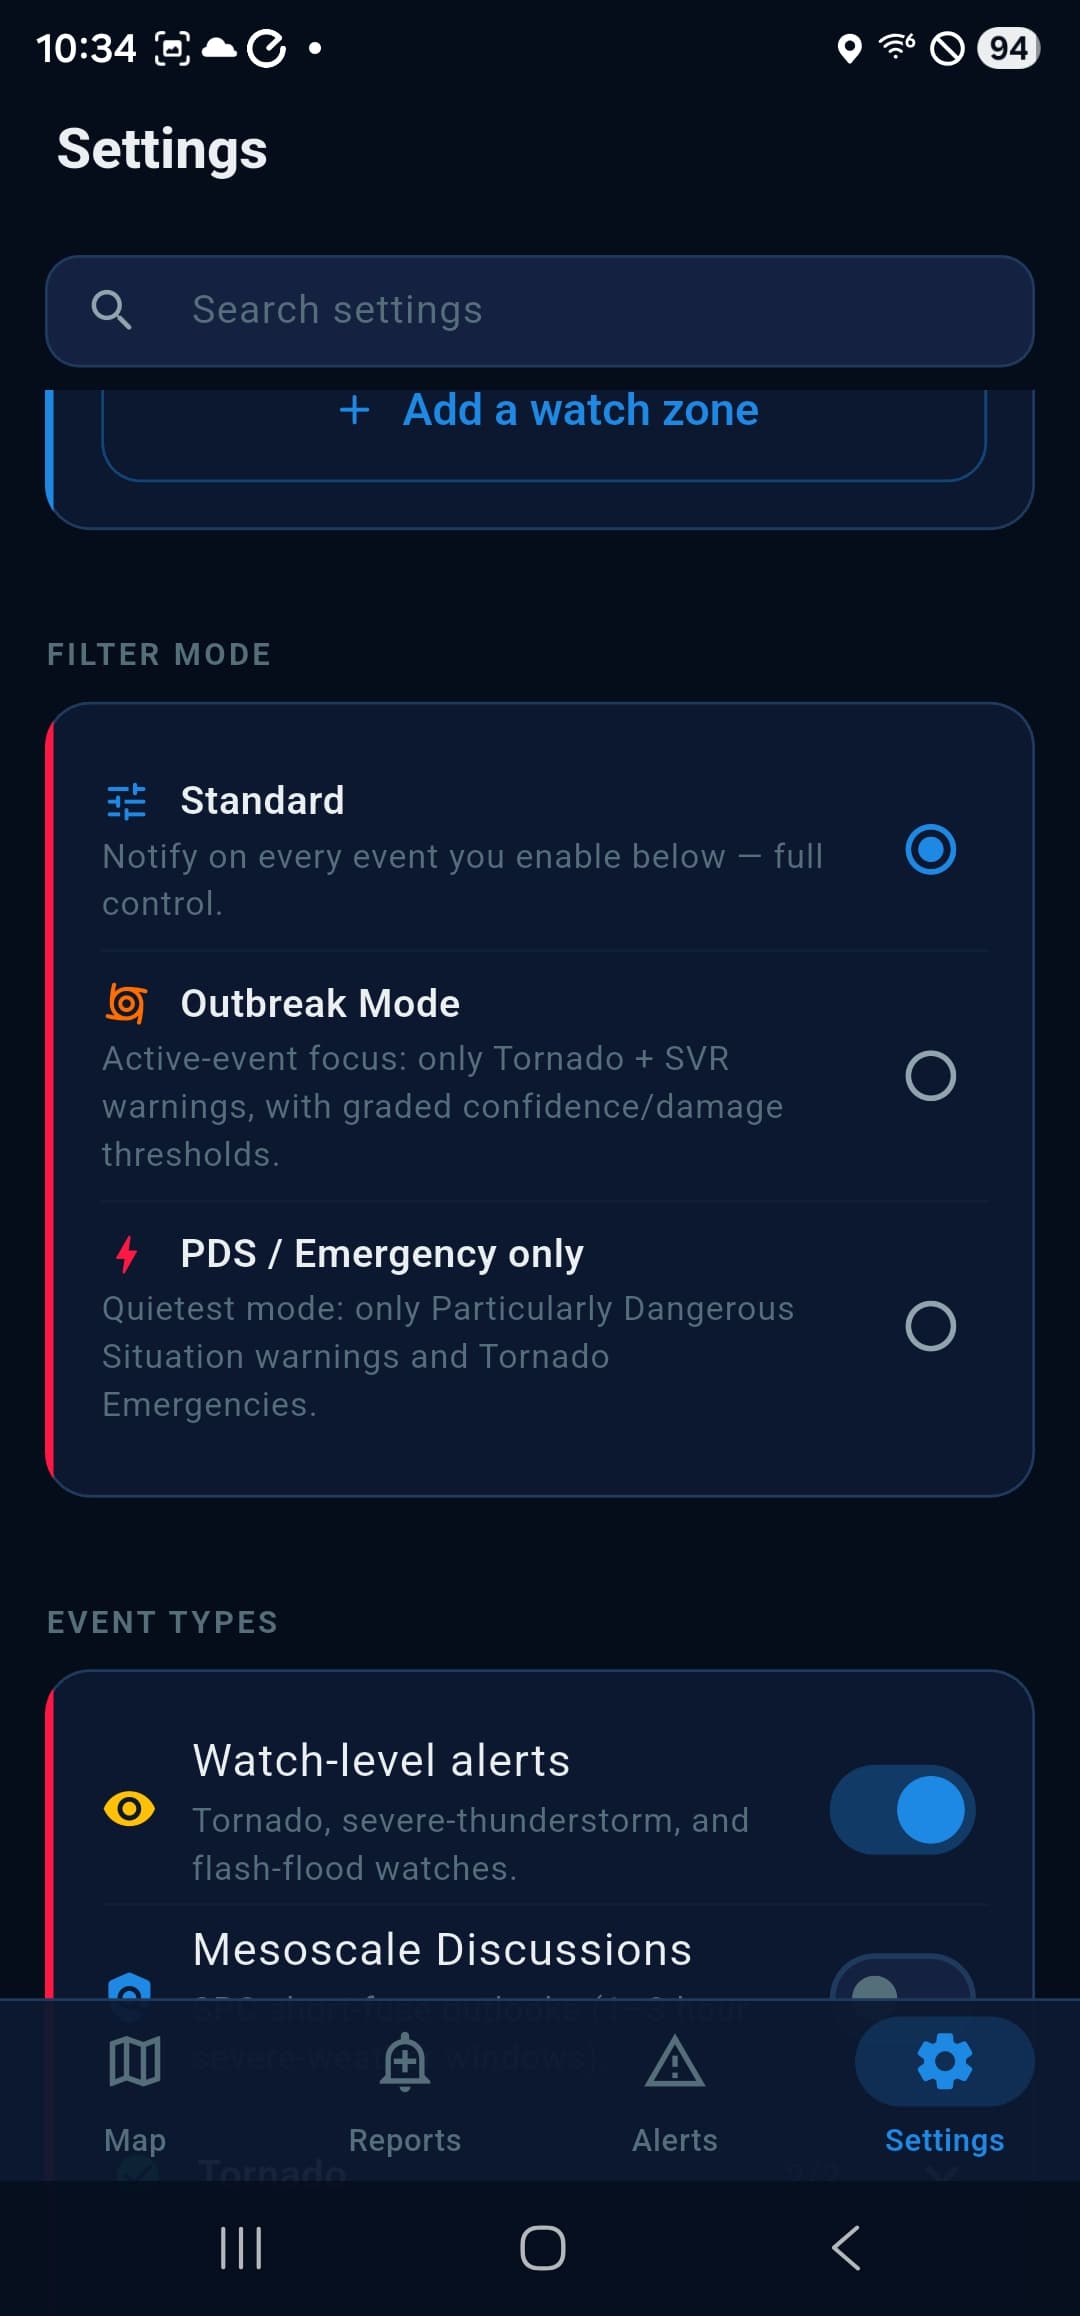
Filter modes (including Outbreak)
Choose between standard severity filtering or 'Outbreak' mode for active multi-state events where you want broader coverage.
Event-type filters
Per-event toggles for tornado warnings, severe thunderstorm warnings, flash flood, fire weather, and more.
Earthquake alerts
Alerts based on what you would actually feel rather than a fixed radius, so a distant large quake reaches you and a small nearby one does not spam you. Set your own magnitude floor, with an optional major-quakes-anywhere-in-the-US toggle. Off by default.
Wildfire alerts
New incidents discovered near you, with a minimum-size picker and a prescribed-burn filter, plus rapid-growth alerts for a fire you are already watching. Off by default.
Air quality alerts
Fires when the monitor nearest one of your zones crosses the EPA category you pick, with optional follow-ups as it keeps worsening. Off by default.
Custom sound profile + DND override
Bundled severe-alert tone or stock system sounds, with an option to bypass Do Not Disturb for the most critical events.
Full-screen Tornado Emergency takeover
On Android 14+, opt-in alarm-style full-screen intent for Tornado Emergencies and PDS warnings, waking the screen even when locked.
Custom flash colors
Pick distinctive flash colors per alert tier so a tornado warning never looks like a flood advisory.
Significant report & MCD pings
Optional notifications when SPC posts a new mesoscale discussion or a high-tier storm report lands inside your zones.

Reporting
Severe Weather Reporting
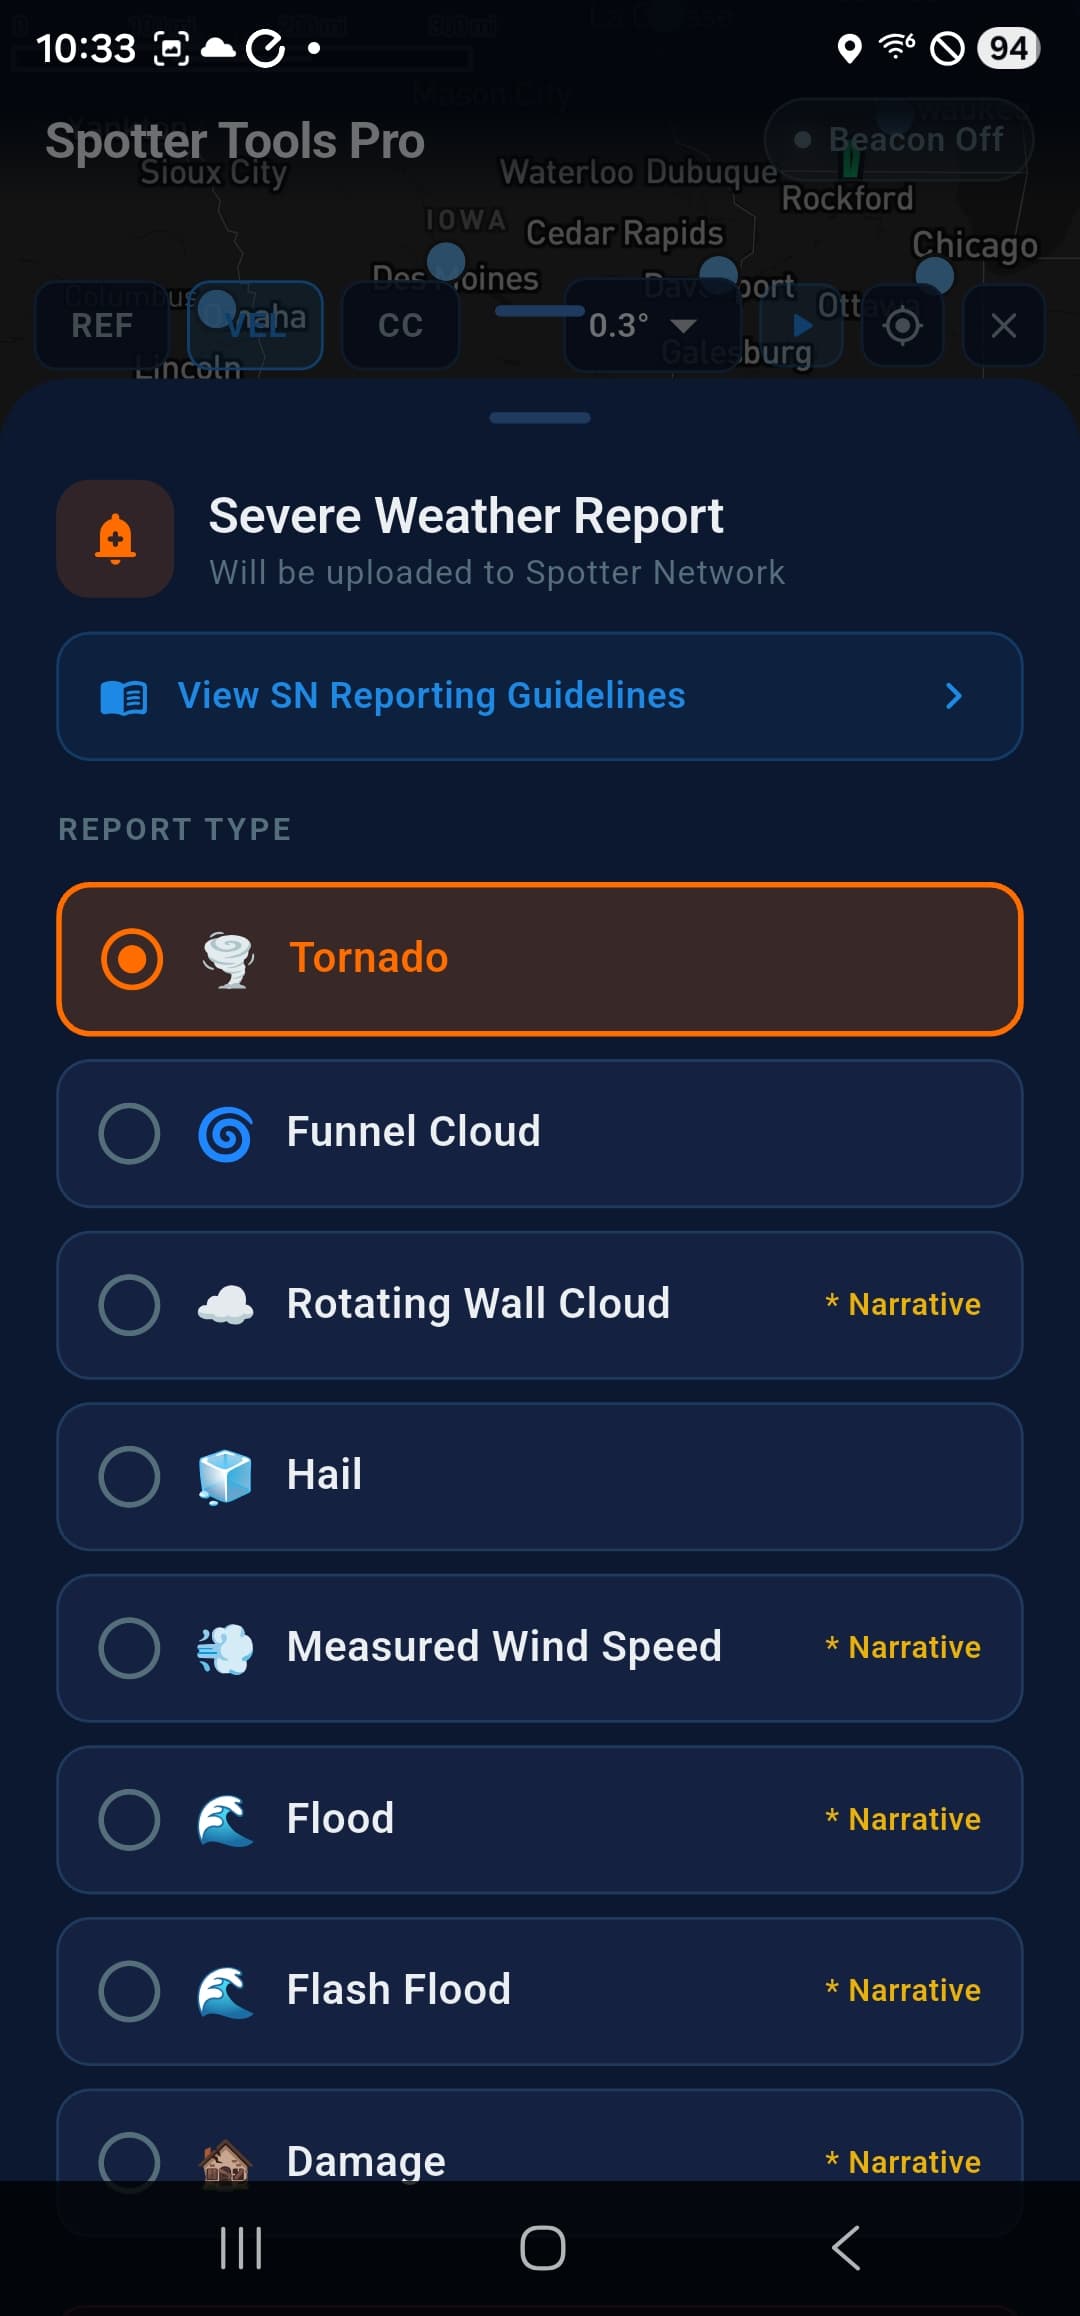
File reports straight from the field, directly to Spotter Network, with the right metadata baked in.
All Spotter Network report types
Tornado, funnel cloud, wall cloud, hail, damaging wind, flooding, and damage, each with the right structured fields.
Reporting guidelines
Built-in reporting guidelines reference so you can submit a clean report under pressure.
Local report history
Every report is saved to a local SQLite database for your own records, even when offline.
Browse SPC reports on the map
Toggle live NWS Local Storm Reports as map markers, every report type the offices publish, and tap any of them for full detail.
Presence
See Other Spotters (Opt-In)
An optional, privacy-first way to see other Spotter Tools Pro users on the map, and let them see you.
Opt-in only, off by default
Nothing about your location is shared until you turn Presence on, and you can turn it off any time.
Avatars, usernames & bios
Opted-in users appear with their chosen map avatar, username, and a short bio you can read from a tap sheet.
Built to stay free & fast
Powered by an edge-cached backend so the map stays snappy and the feature stays free, no subscription, ever.
Windows
A Real Desktop App, Not a Stretched Phone App
The same app on Windows, with the things a desktop can do that a phone cannot: a big canvas, a mouse, and the ability to keep watching while you get on with something else.
Close it and keep the alerts
Hit the X with alerts on and Spotter Tools Pro hides to the system tray instead of quitting, so the watch worker keeps polling and warnings still reach you while the window is gone. It asks you once what you want it to do, and Settings holds the answer if you change your mind.
Draws at your monitor's rate
The map was held to 55 frames a second no matter what your display could do. It now draws at your panel's rate, measured 55 to 154 on a 165 Hz monitor, so a pan is even rather than stuttering. On a 60 Hz monitor you were always getting the full 60, so this is not something you will see.
Dual view you can resize
Drag the hairline between the two panes to give one more room. The second pane follows zooms as well as pans, so the two maps stay in step instead of drifting apart, and satellite always draws under radar whatever order you turn them on in.
Right-drag to orbit
Hold the right mouse button and drag: sideways turns the map, up and down tilts it, with proper inertia when you let go. Ctrl and left-drag does the same on a trackpad, and a touchscreen gets twist and two finger tilt.
Tuned for the machine you have
A 4K panel on integrated graphics asks for a lot of pixels. The map measures what your machine can actually do and trims its own work to match, so a laptop iGPU stays responsive instead of grinding.
Customization & Setup
Set It Up the Way You Like
Spotter Tools Pro is opinionated about defaults but gives you control over the things that matter.
Guided onboarding
A four-step setup walks you through permissions, map data, and the beacon so you're operational the first time you open it.
Searchable settings
A sticky search field at the top of Settings filters every control on the page, so you find a toggle in seconds.
More map, when you want it
Collapse the bottom navigation bar on the map into a slim strip and hand its height back to the map. Tap the strip to bring it back, and the choice sticks.
Built to be read at arm's length
The app carries its own typefaces so it looks the same on every platform, with a monospaced face for every number so figures line up in a column. Chrome floating over the radar is drawn neutral, because colour over the map is reserved for data: an accent that lands inside the reflectivity ramp is one you have to decode twice.
Connection status indicator
An always-visible chip on the map shows whether you're online, on cellular, or offline.
Active spotter info sheets
Tap any active spotter to see their callsign, vehicle, and last update without leaving the map.
In-app Contact & Feedback
Send feedback or reach out to support right from Settings, without leaving the app.
Private by default
No ads, no third-party trackers, and nothing sold to anyone. Your beacon goes to Spotter Network and weather data comes from NWS / SPC / Mapbox. The app collects anonymous usage statistics to guide what gets built next, with no account or identity attached, and you can turn it off in Settings under Privacy. The only thing we store is an optional account, if you choose to create one.
More to explore
Bonus details
A few extra views that don't fit neatly in the categories above.
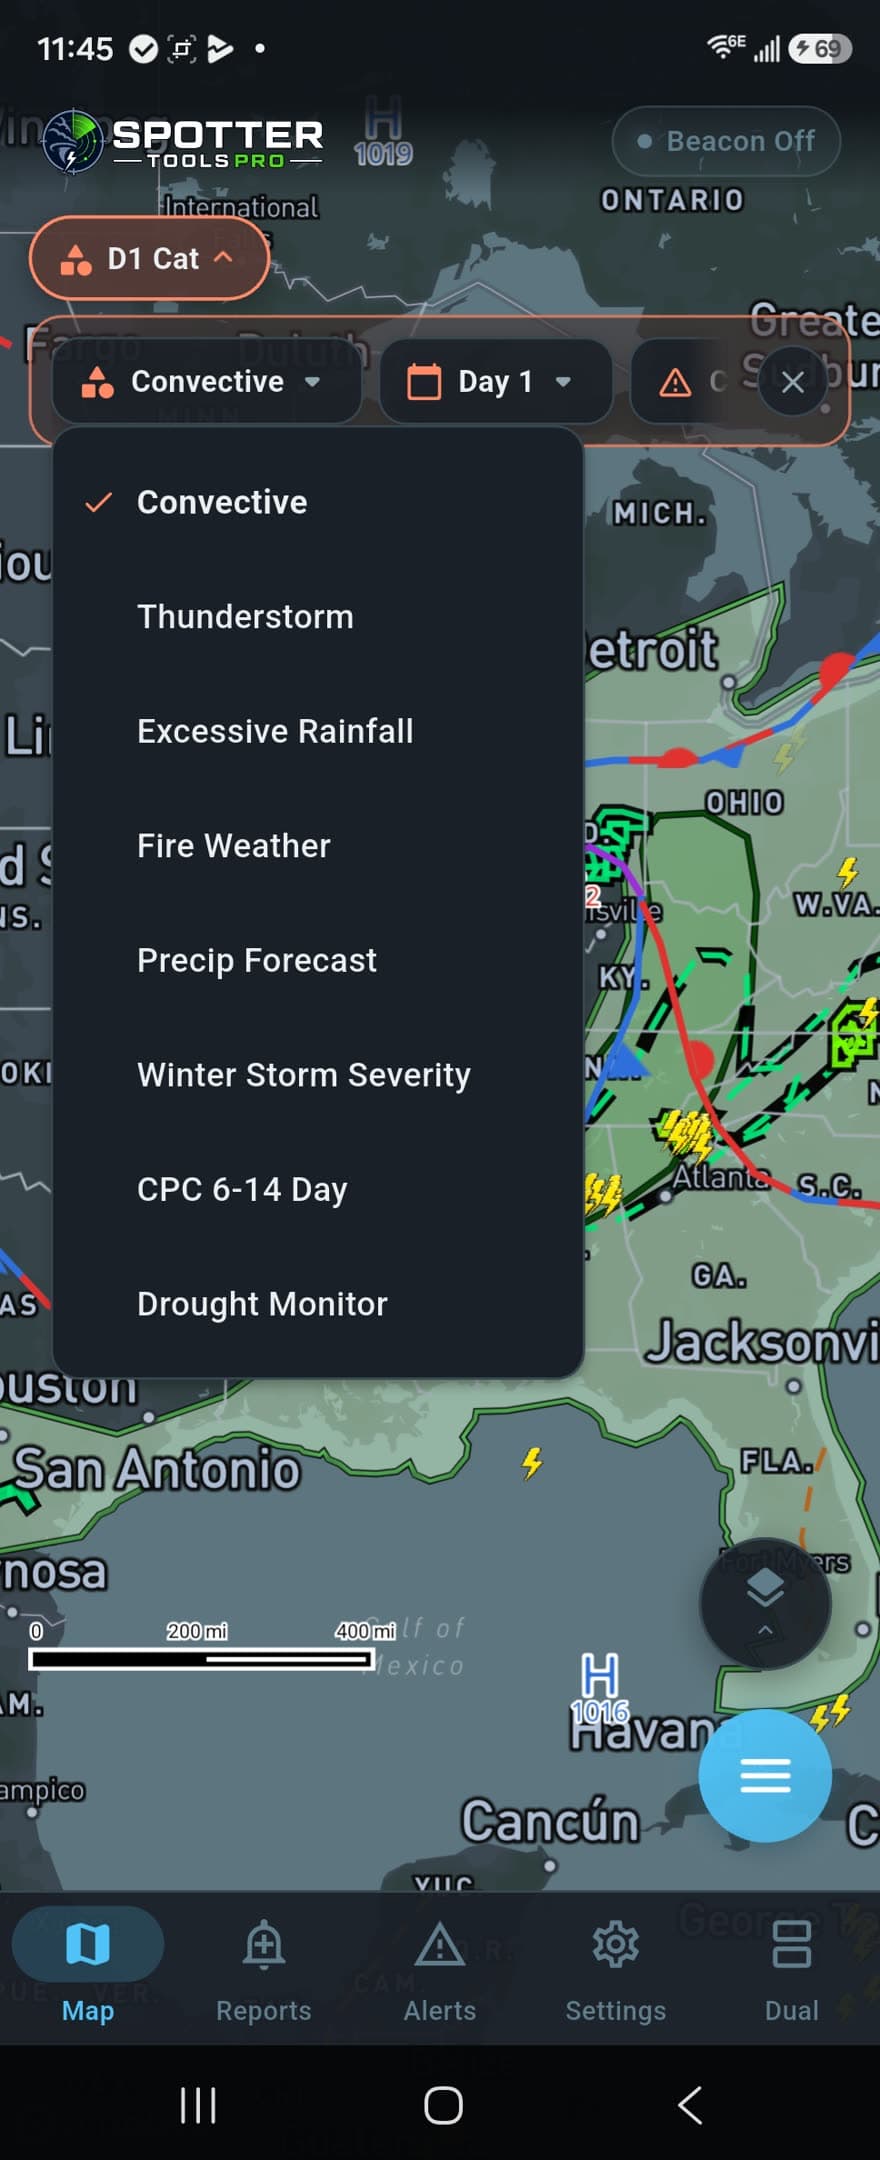
The full outlooks suite: convective Day 1 to 8, fire, WSSI, CPC, drought
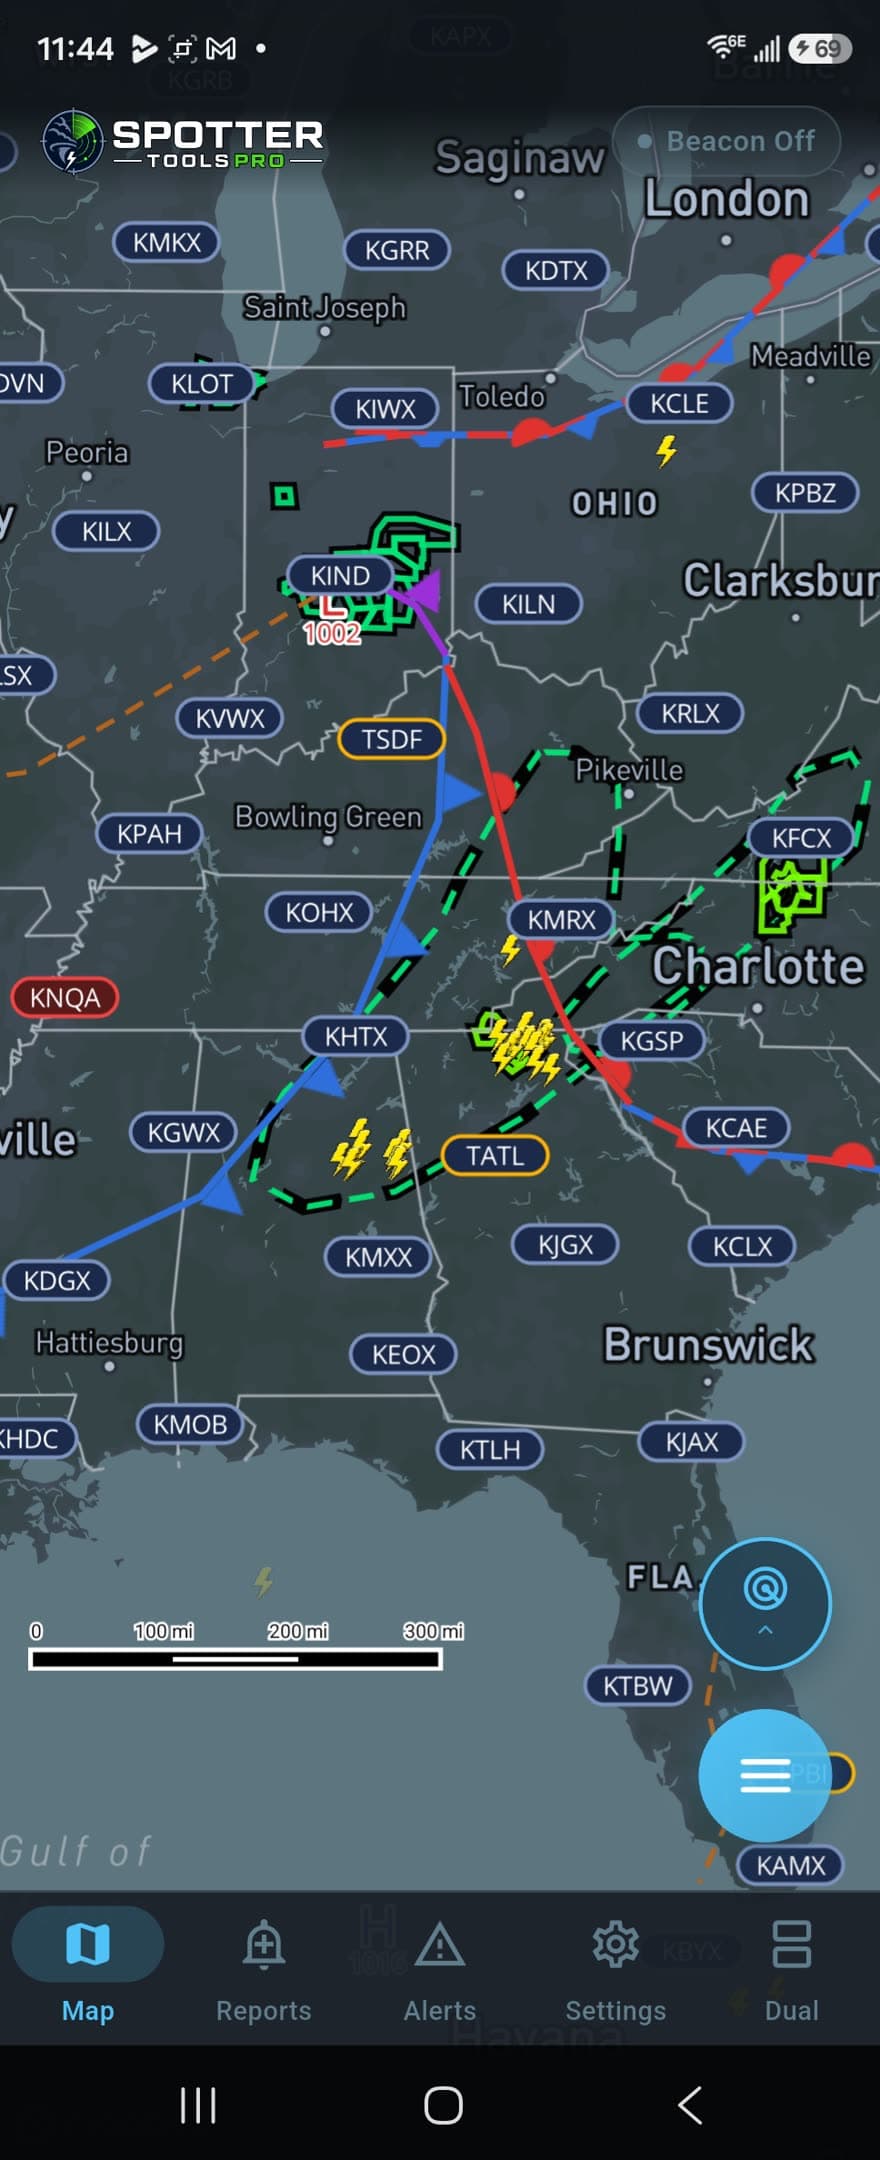
WPC surface analysis: fronts plus high and low pressure centers
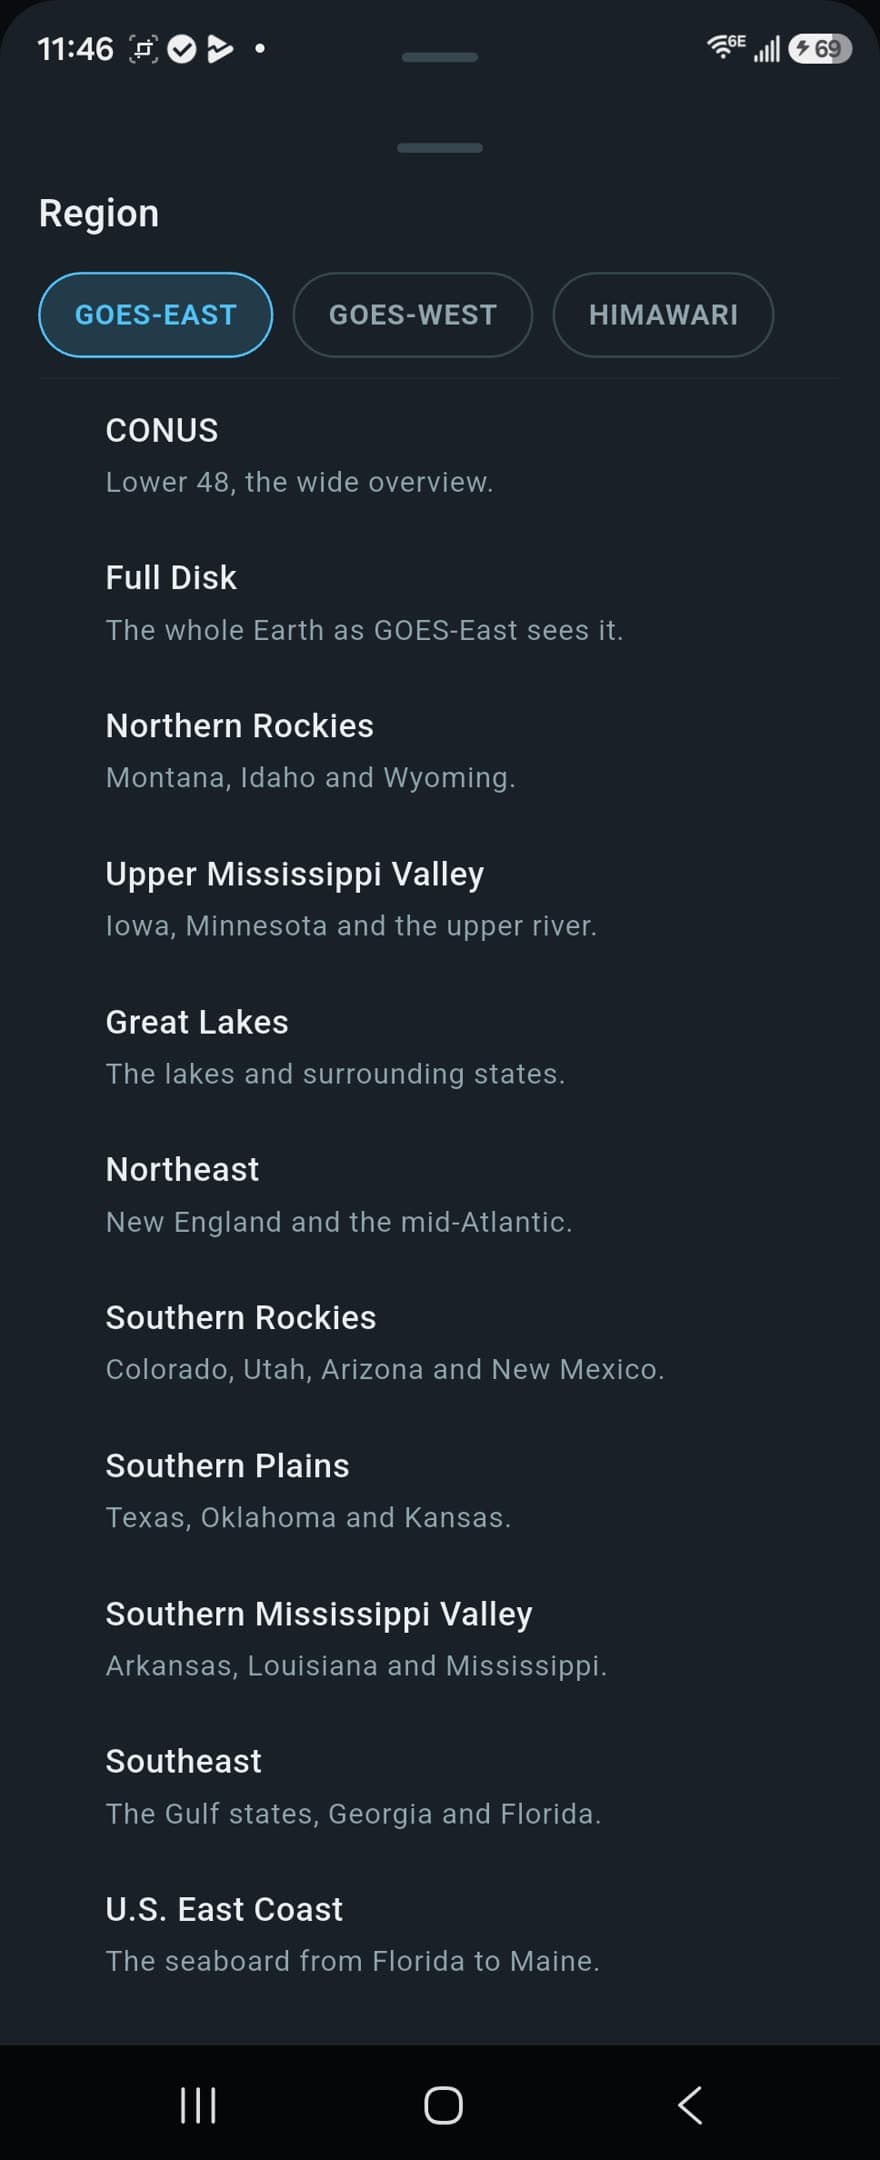
22 GOES-East and 12 GOES-West sectors, grouped by spacecraft
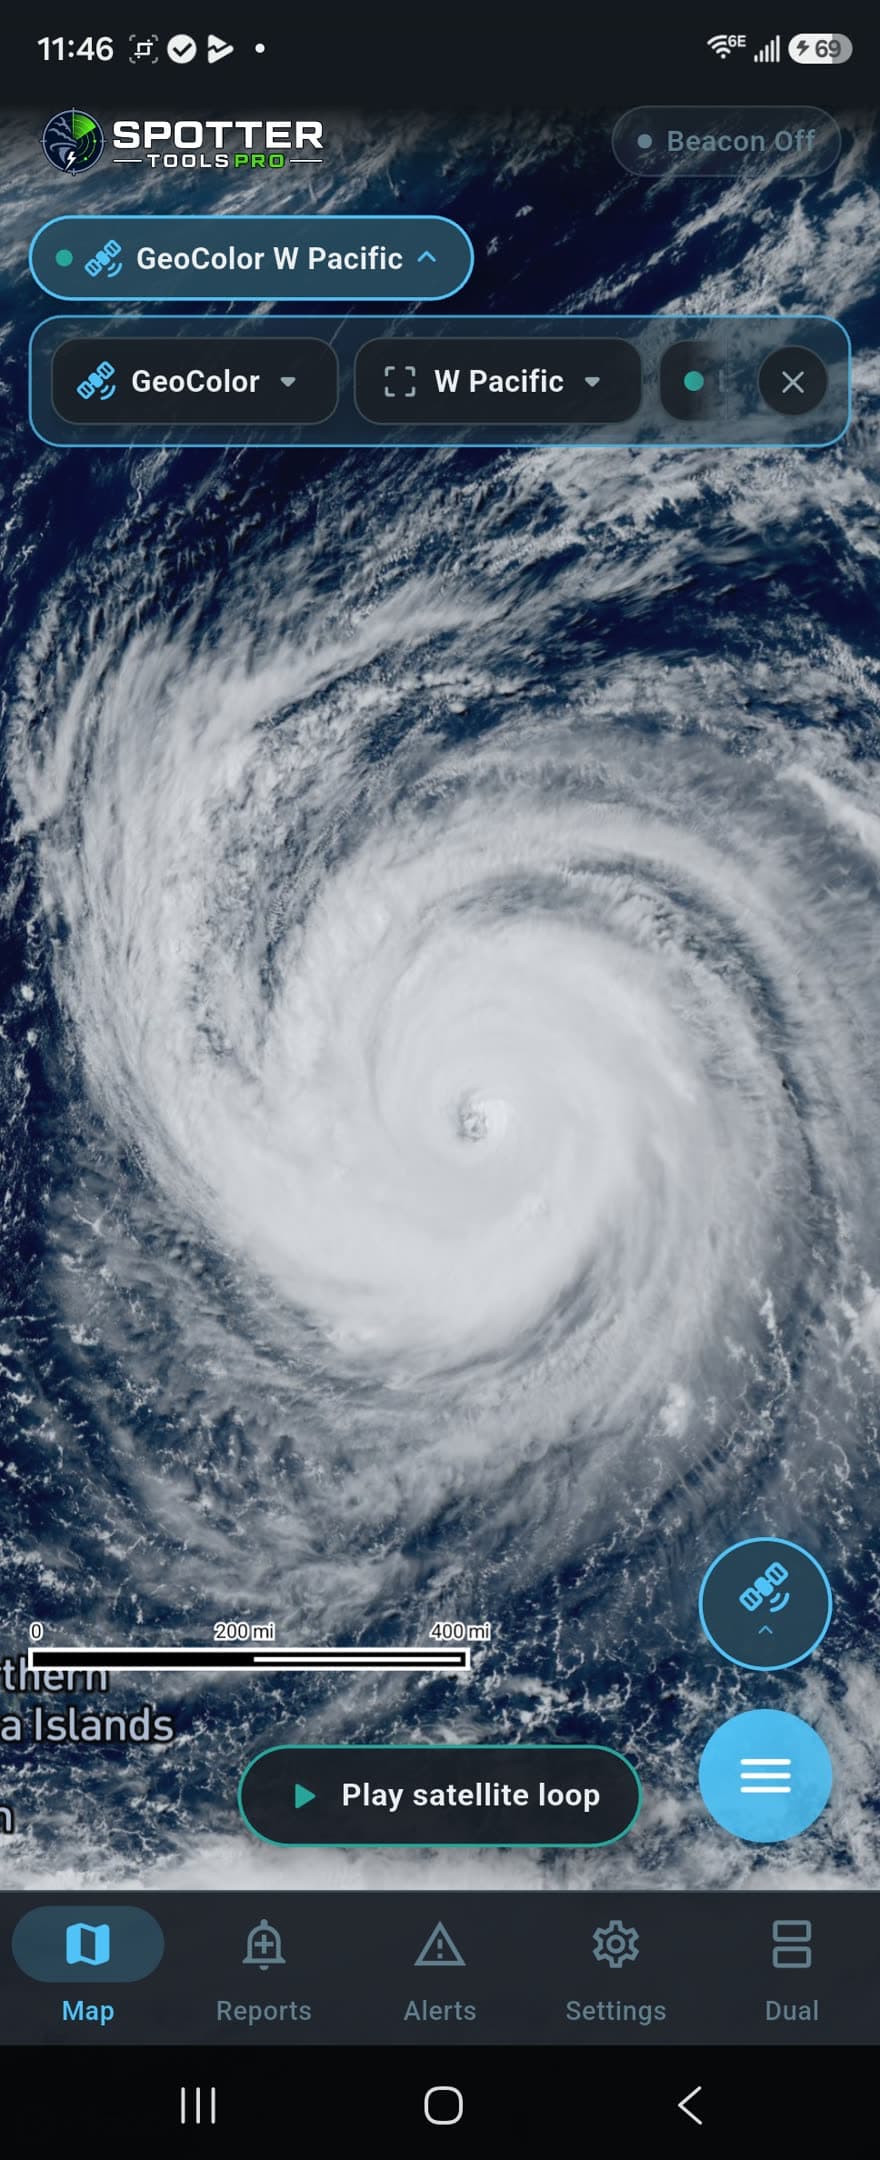
West Pacific typhoon basin, Himawari GeoColor via CIRA
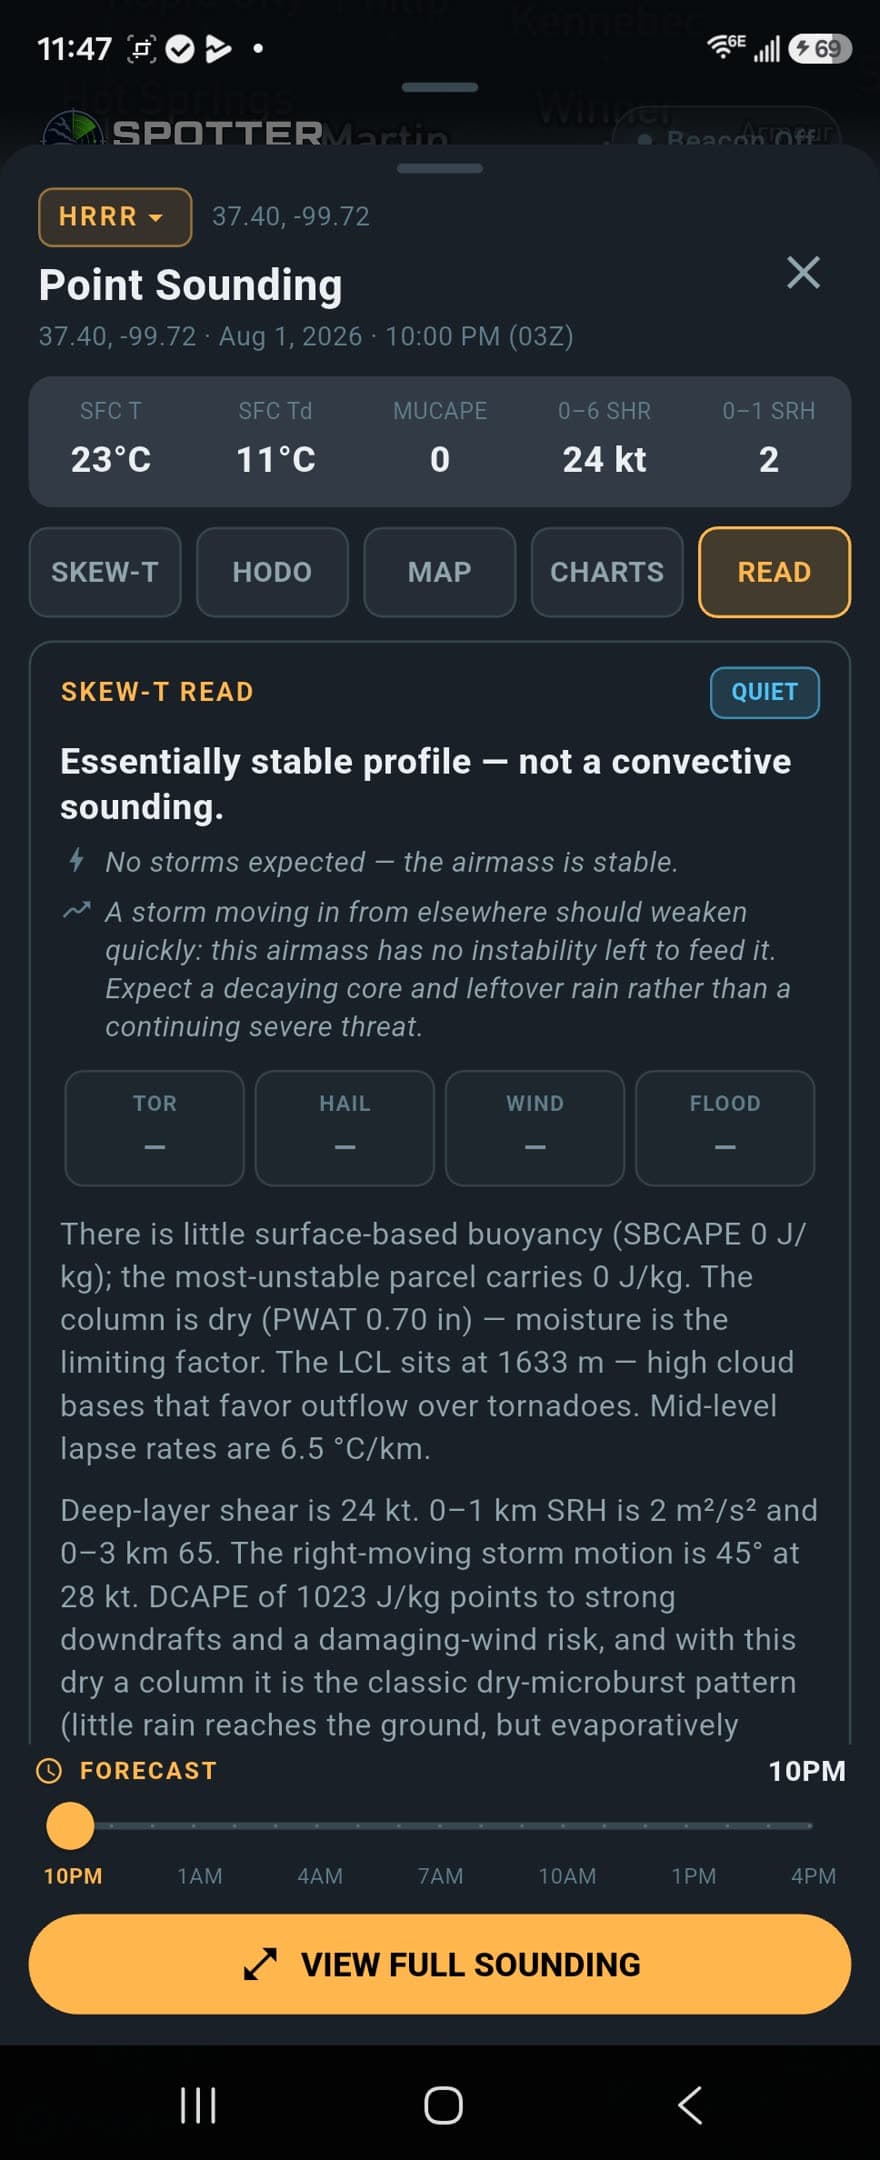
Soundings explained in plain language, including inbound storms
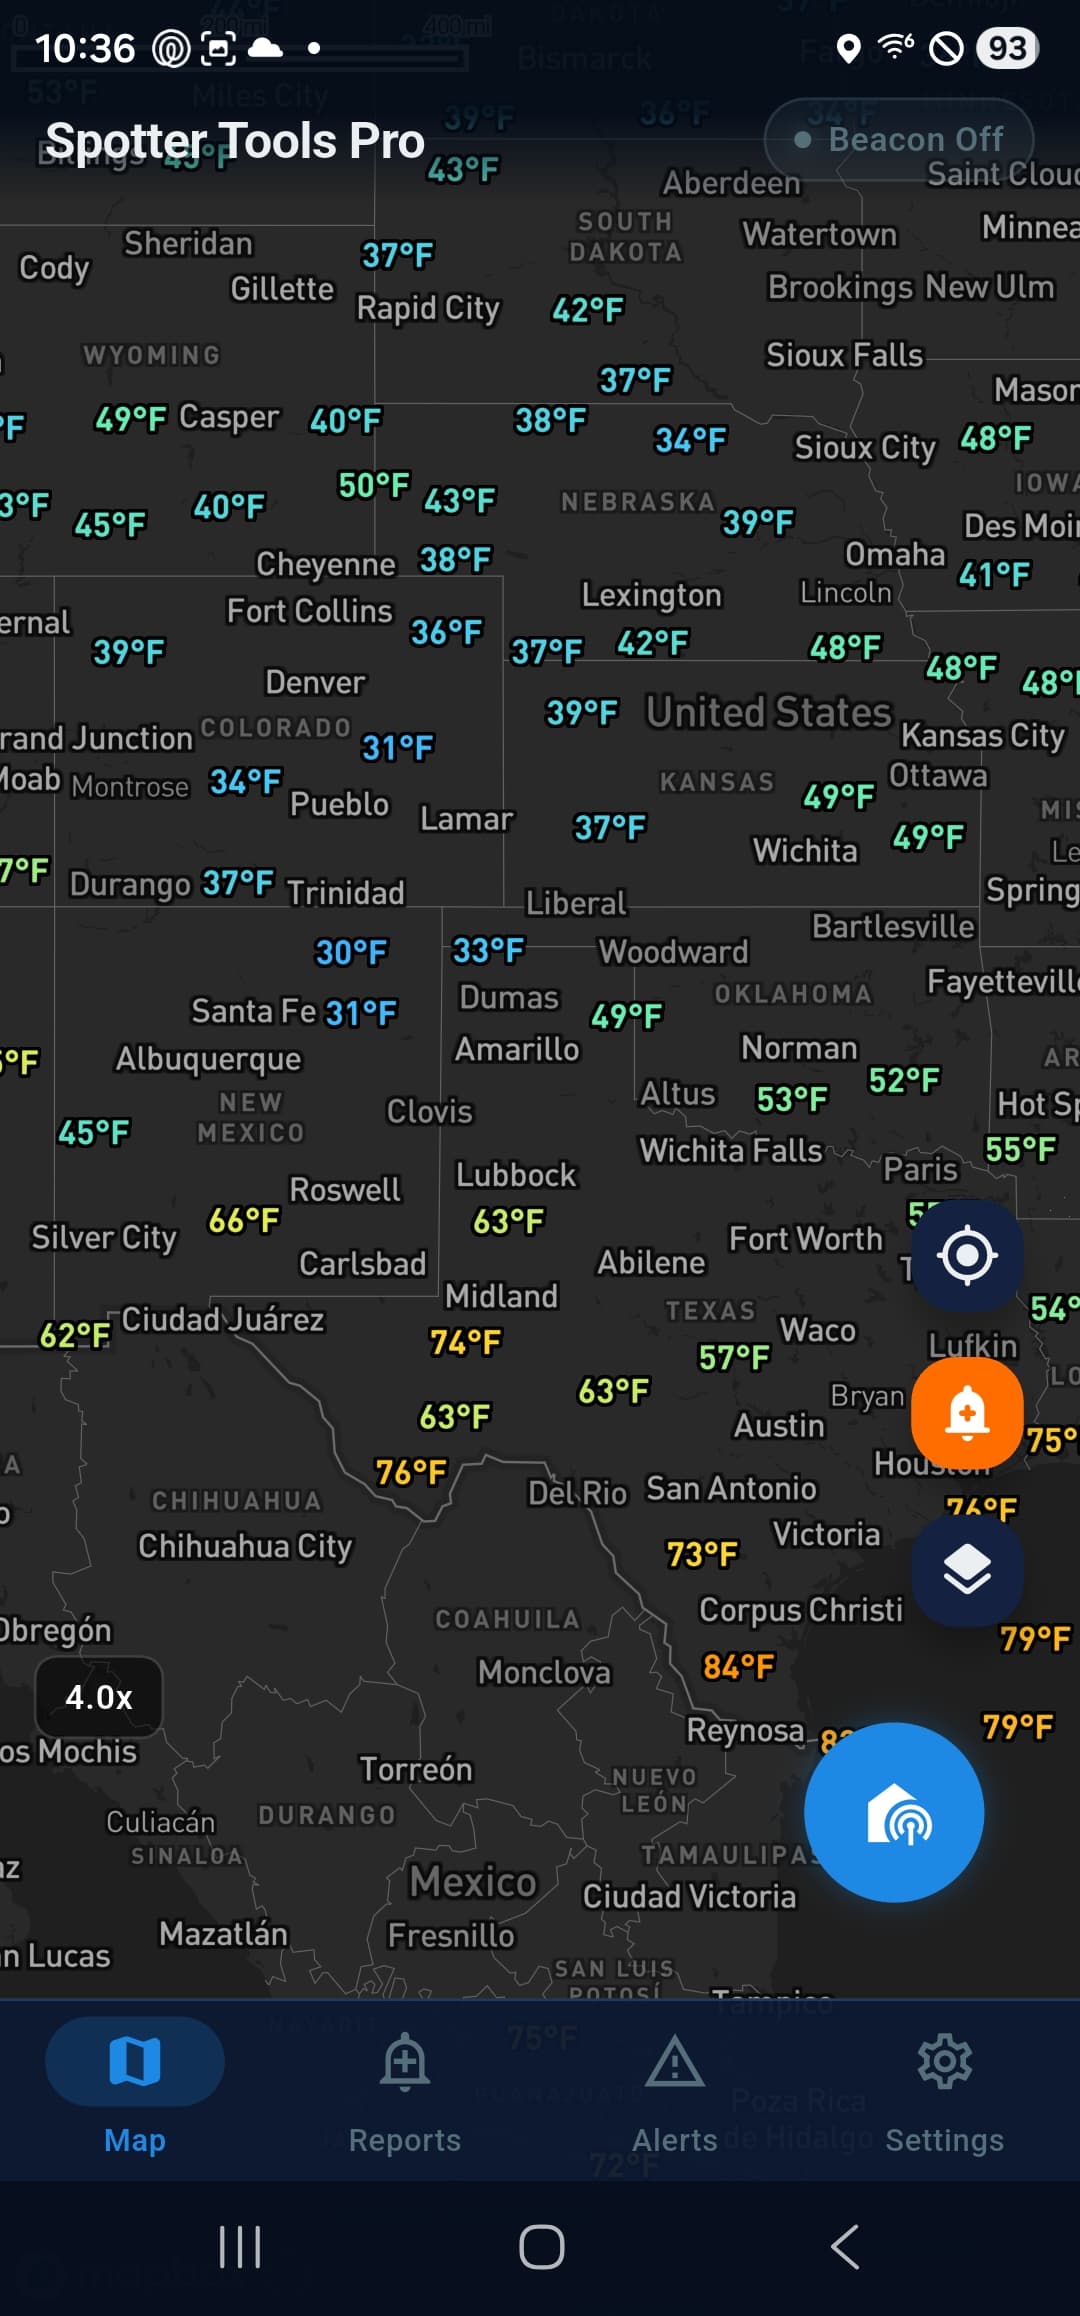
METARs: live airport temperatures across the country
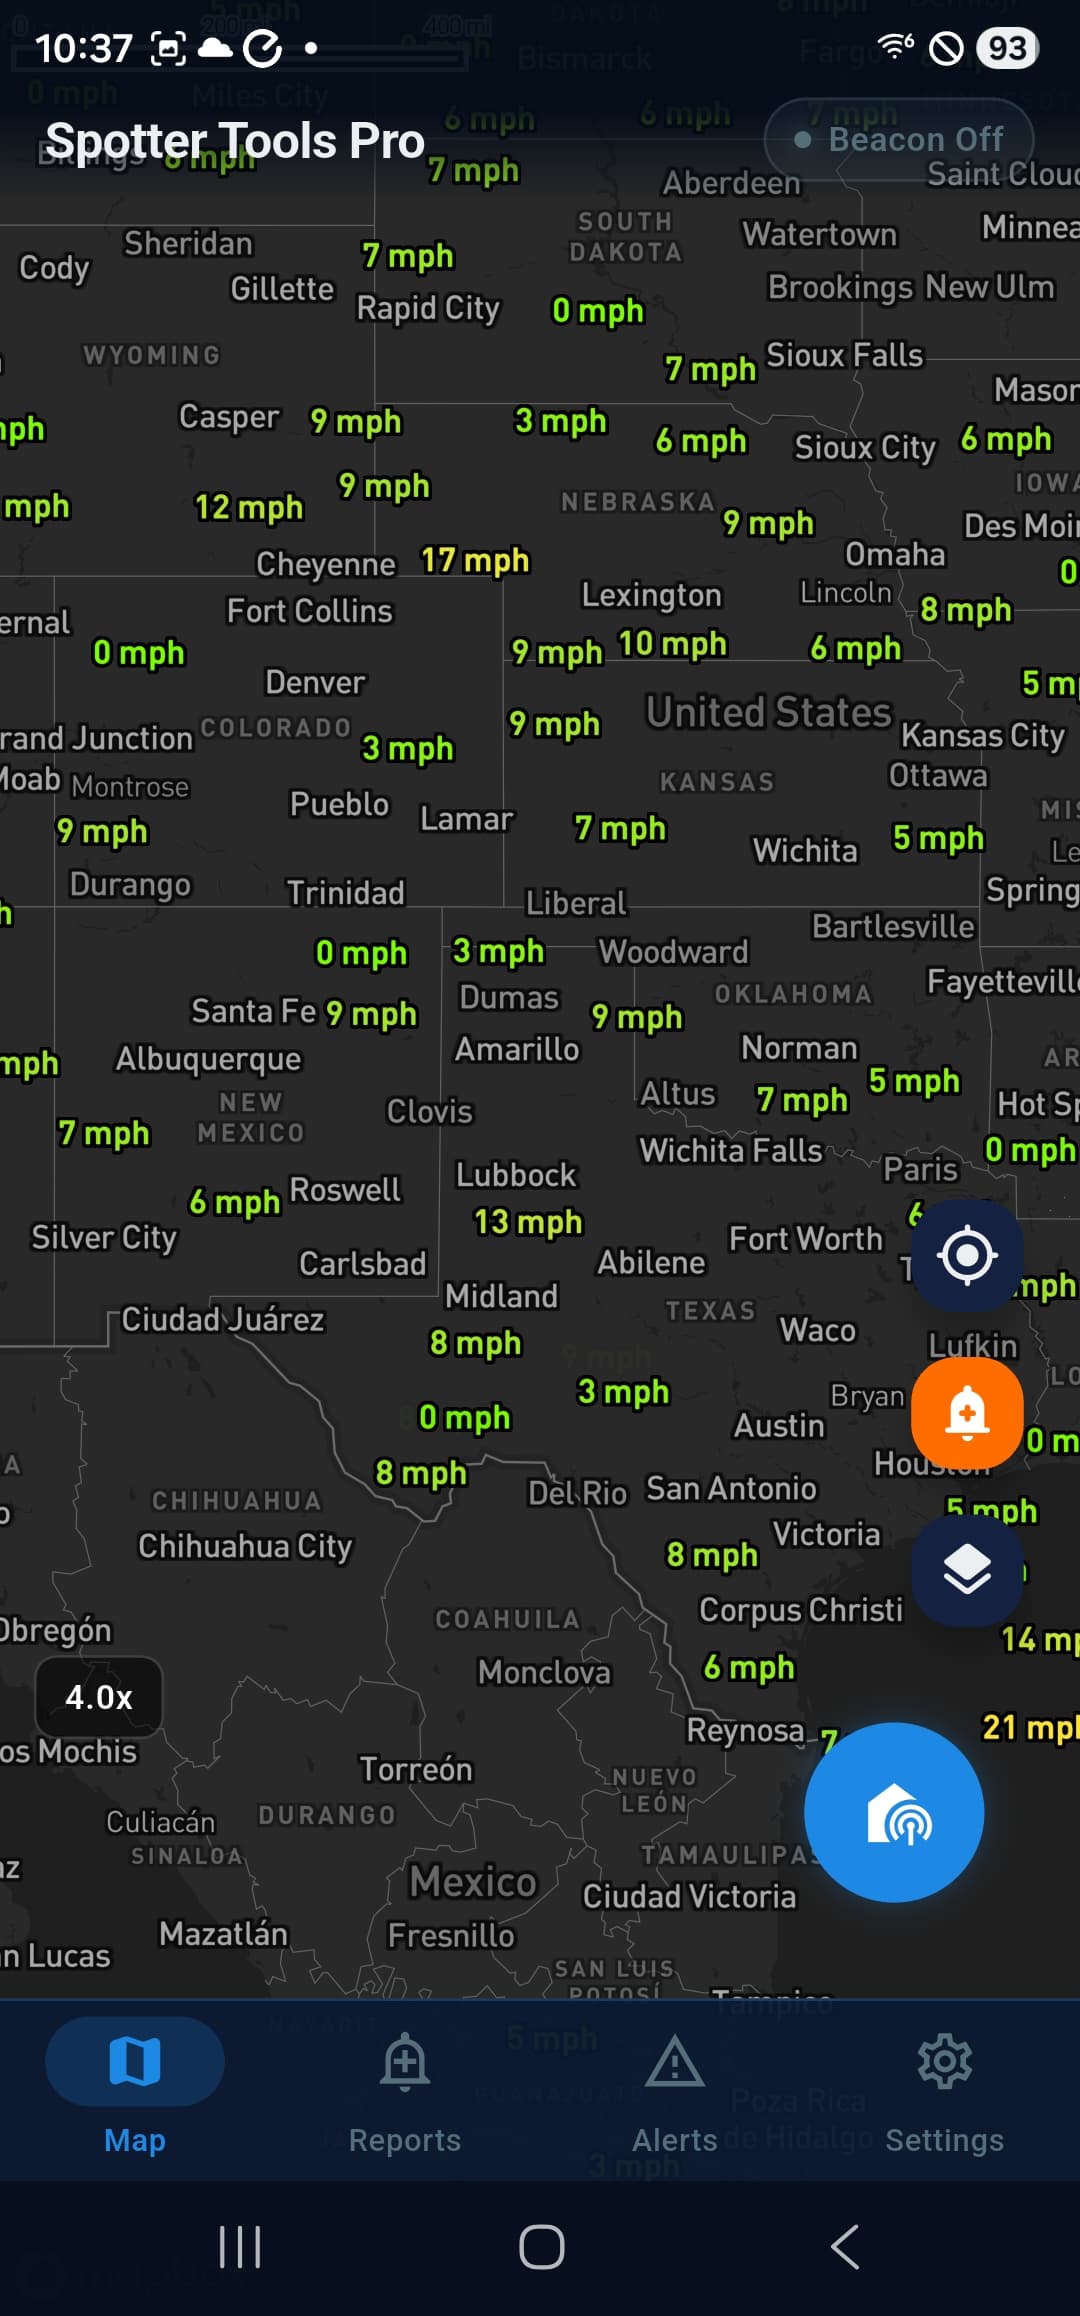
Switch the METAR variable: temp, wind, dew point, and more
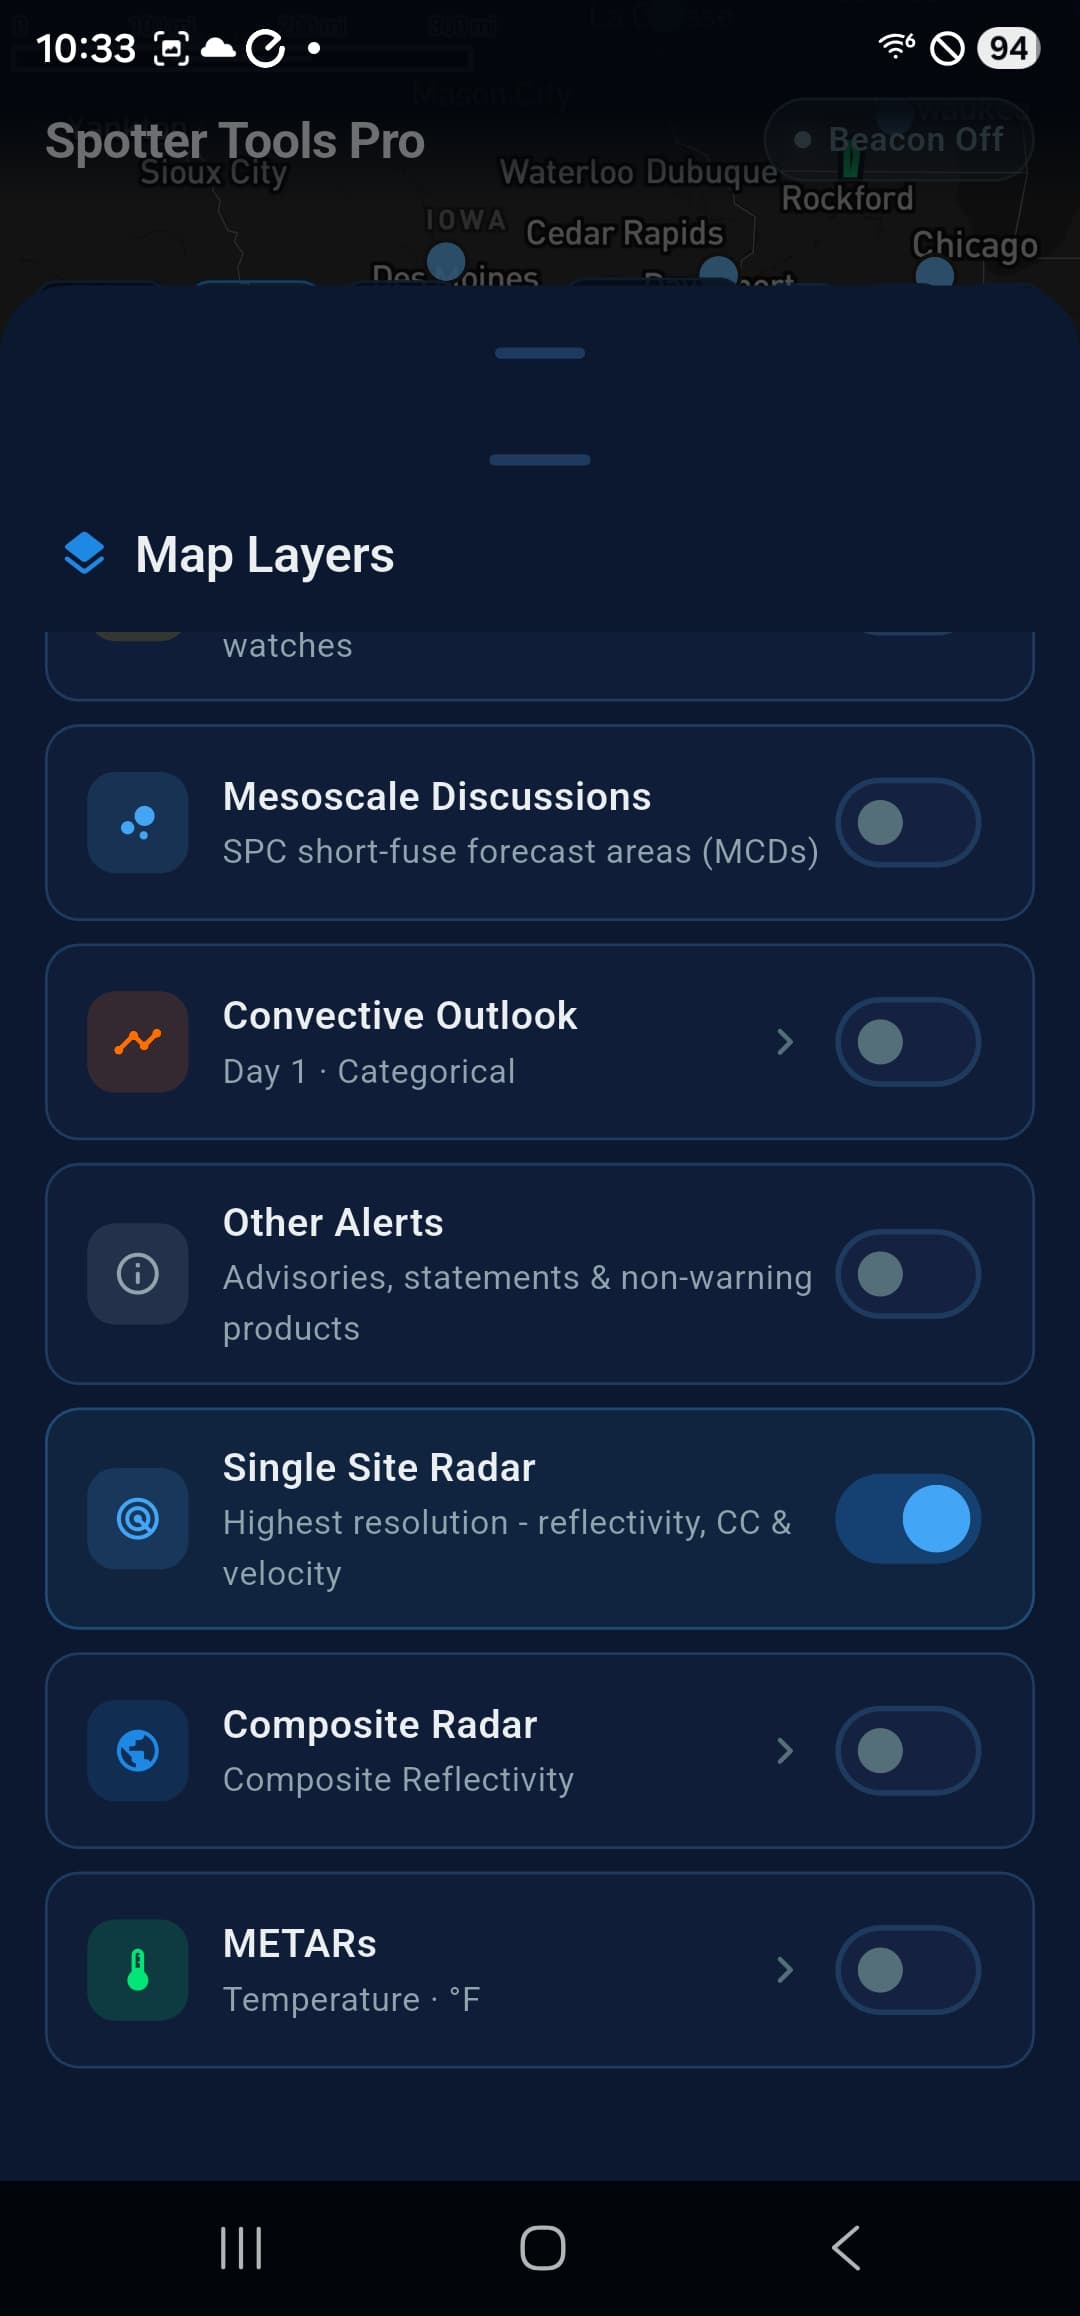
Single-site radar, composite, and METARs in one sheet
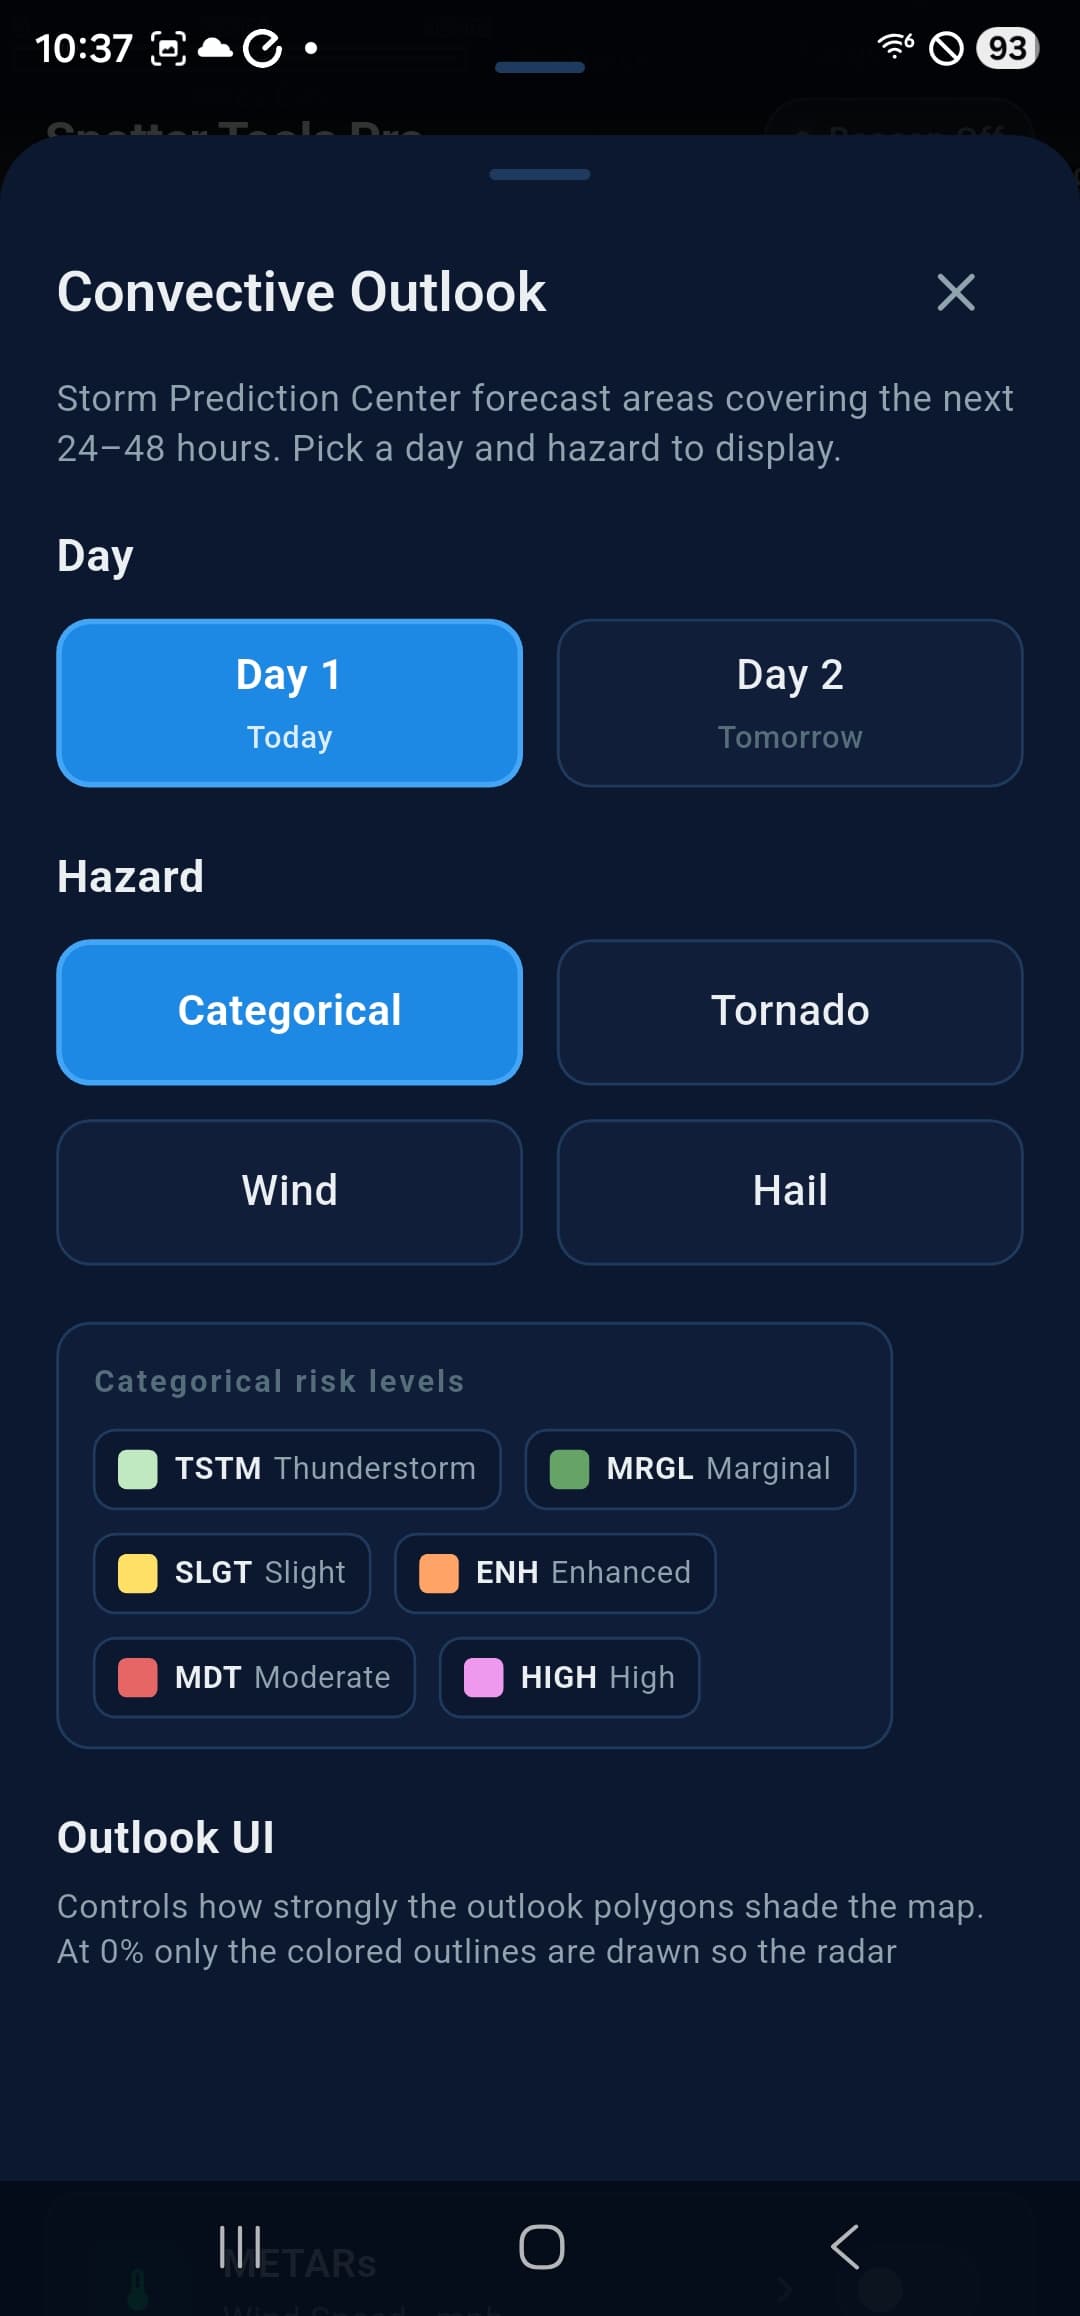
Pick the day, hazard, and visual style for SPC outlooks
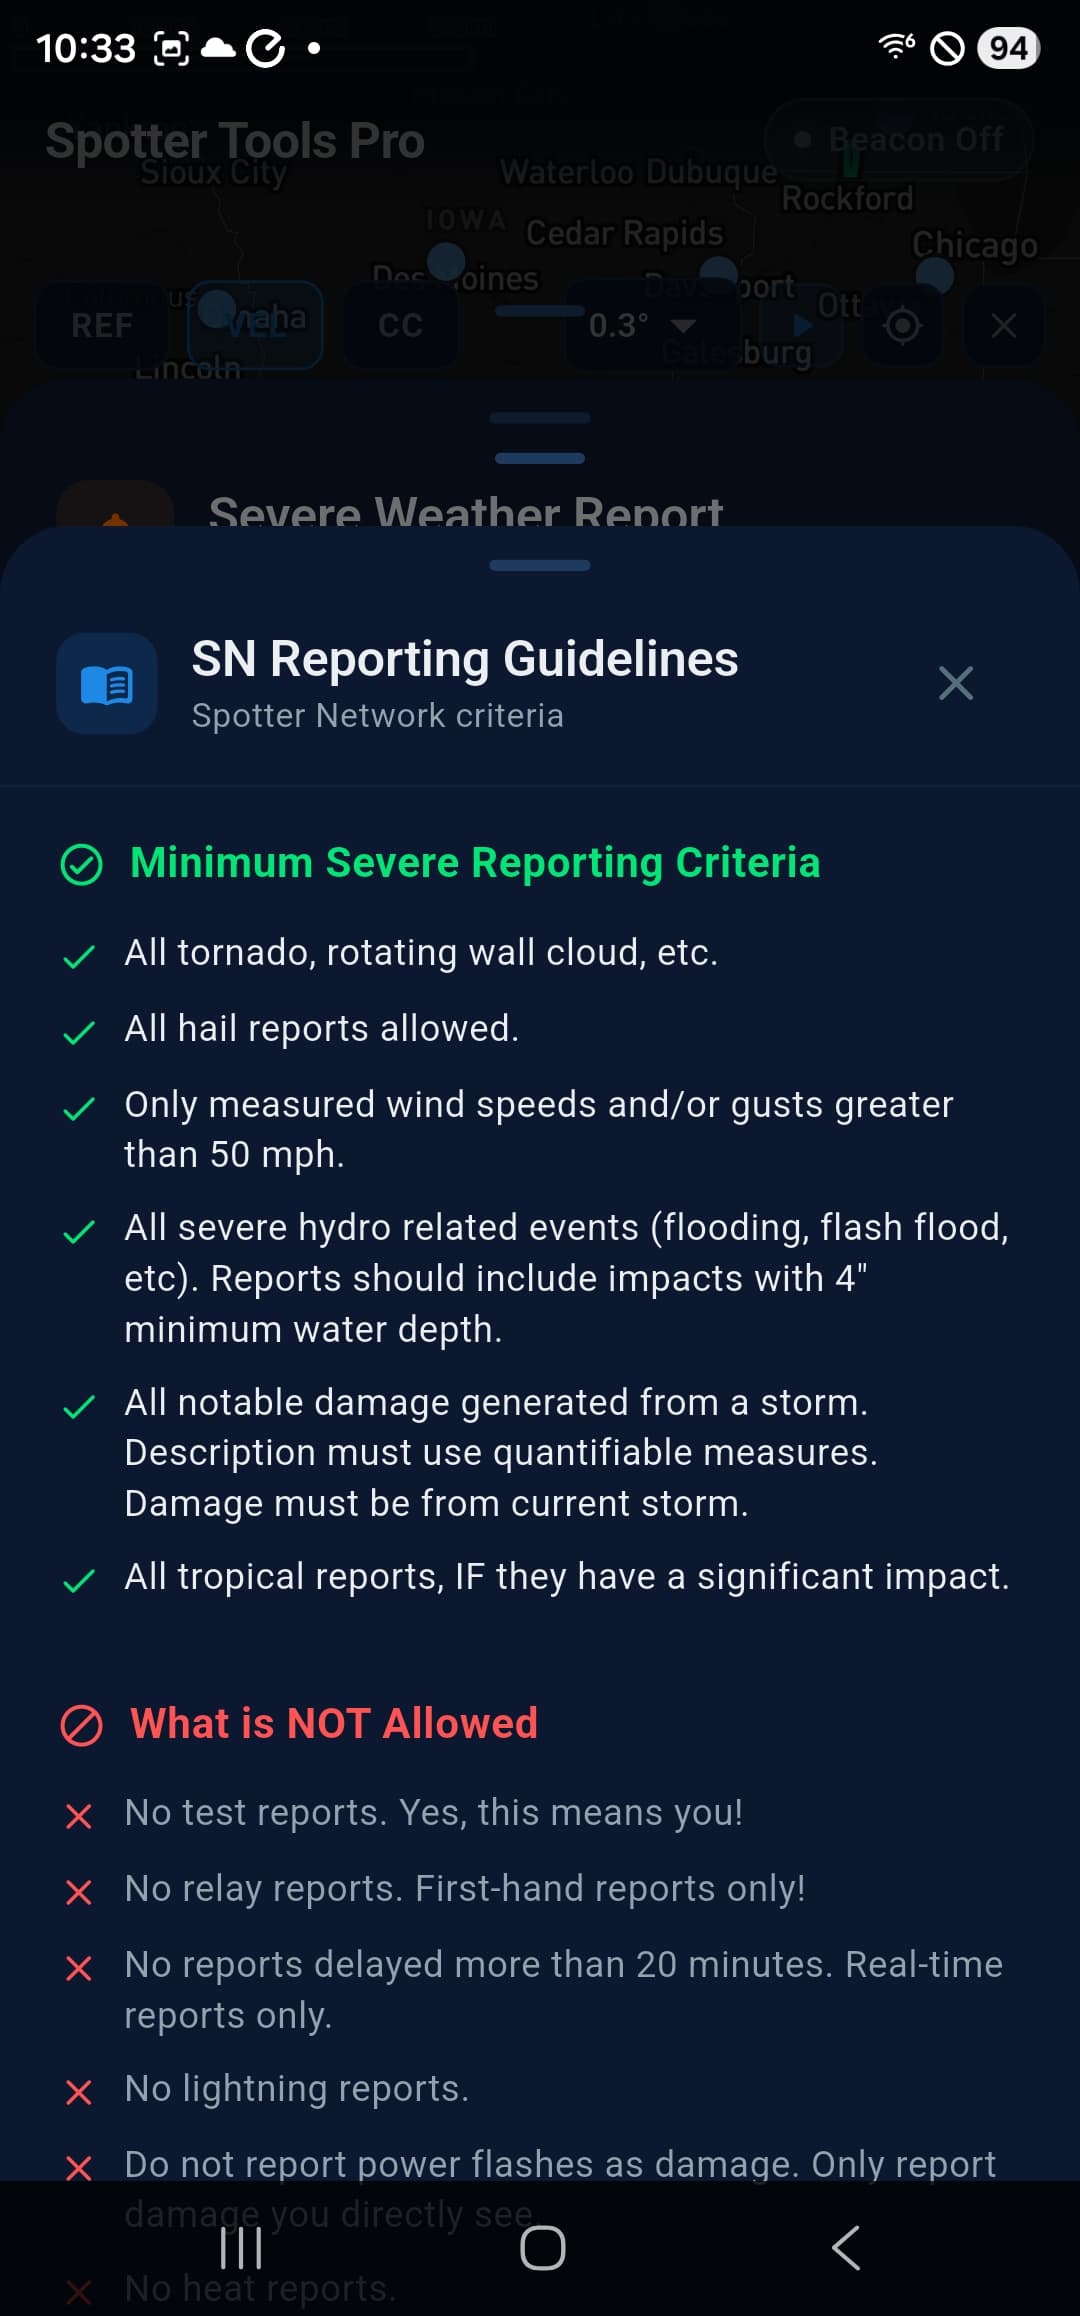
Built-in SN reporting guidelines so reports stay clean